Puppet monitoring: how to monitor the success or failure of Puppet runs


This is a guest post by LogicMonitor's Director of Tech Ops, Jesse Aukeman, about the different ways they're monitoring the success or failure of Puppet runs.
If you are like us, you are running some type of linux configuration management tool. The value of centralized configuration and deployment is well known and hard to overstate. Puppet is our tool of choice. It is powerful and works well for us, except when things don't go as planned. Failures of puppet can be innocuous and cosmetic, or they can cause production issues, for example when crucial updates do not get properly propagated.
Why?
In the most innocuous cases, the puppet agent craps out (we run puppet agent via cron). As nice as puppet is, we still need to goose it from time to time to get past some sort of network or host resource issue. A more dangerous case is when an administrator temporarily disables puppet runs on a host in order to perform some test or administrative task and then forgets to reenable it. In either case it’s easy to see how a host may stop receiving new puppet updates. The danger here is that this may not be noticed until that crucial update doesn't get pushed, production is impacted, and it’s the client who notices.
How to implement monitoring?
Monitoring is clearly necessary in order to keep on top of this. Rather than just monitoring the status of the puppet server (a necessary, but not sufficient, state), we would like to monitor the success or failure of actual puppet runs on the end nodes themselves. For that purpose, puppet has a built in feature to export status info about its last run into a file (by default /var/lib/puppet/state/last_run_summary.yaml). This file contains all sorts of useful performance information and looks something like this:

This is a useful summary of the last job run info, and a great basis for monitoring. With this alone, there are a number of approaches to expose this information to a monitoring solution (some type of host based agent, exposing the data points via snmp, etc). For our approach, we had already been working with another puppet tool named MCollective along with its included Registration plugin (http://docs.puppetlabs.com/mcollective/reference/plugins/registration.html). MCollective (Marionette Collective) is a framework for server orchestration that allows parallel job execution. The Registration plugin works within this MCollective framework and allows all hosts to send “registration” information into the collective that can be processed and centrally stored. The default registration plugin will register all kinds of interesting information about puppet along with the last_run_summary info from the yaml file mentioned earlier. As we already had MCollective running and registering this info, it was easy for us to choose this direction.
In our instance, we are using MongoDB as our central registration database. Because Mongodb is “schemaless” it can handle your registration data however structured (i.e. it’s simple to add additional data, change data, etc). All of our servers are part of a mcollective “collective” and they periodically send their registration info (including puppet facts and last run summary info) into the “collective”. There is an MCollective registration agent that then receives the registration info and stores it in our central Mongo database in json format.
Here is a sanitized excerpt of some of the registration info produced by a query of the Mongo database, including the puppet_last_run_summary info:

Now that we have all this data centrally stored in a database, if you are using a monitoring application such as LogicMonitor, it’s easy to graph this data and setup alerting based on it.
The first piece of information inside the “puppet_last_run_summary” is under the “time” subsection and has key value “last_run”. As it suggests, this data indicates the time that puppet last ran. It is stored as a unix timestamp (number of seconds since the epoch, ie 00:00:00 UTC Jan 1st, 1970). This value will be updated after each puppet run on the node itself, and then this updated value will be propagated to the database when the next registration run occurs. By comparing this timestamp against the current time, you can compute how long it has been since the last puppet run.
Here I have configured LogicMonitor to track this data. You can see below that the puppet runs are semi-random but generally occur every 15 minutes. The sawtooth pattern is a confluence of the puppet cron schedule, the registration interval, and the interval between monitoring checks. We could potentially lower the periods between registration runs, but this would be an unnecessary increase in overhead, and the current resolution of data points is more than sufficient for our purposes.
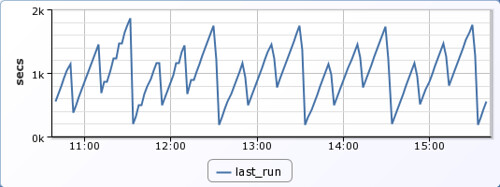
We are now able to set a threshold for alerting. For example, we may want to generate warning alerts if puppet has not updated for a period of 1 hour, and further escalations, at the 2 and 3 hour marks.
To extend this example a bit further, we can create additional graphs for any other datapoints tracked in the puppet_last_run_summary file.
Here are graphs tracking puppet events and the time per puppet run:
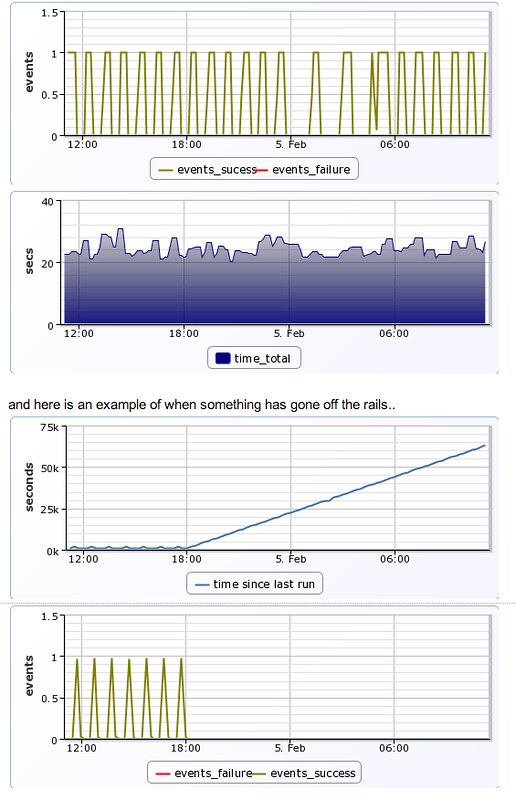
and here is an example of when something has gone off the rails..
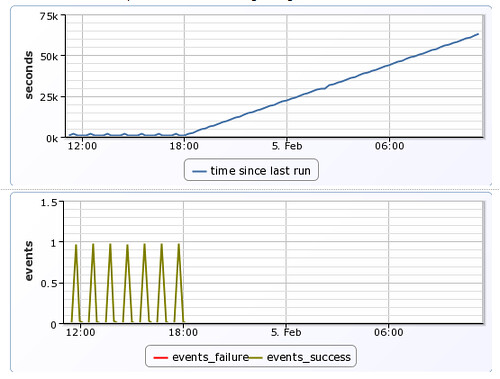
In the above graph you can easily see that puppet runs stopped occurring at approximately 18:00. Shortly after this time, an alert would be generated once the time exceeded configured thresholds, and administrators would be notified so that they may take corrective action.
Here’s an example of the alert generated within the LogicMonitor application:
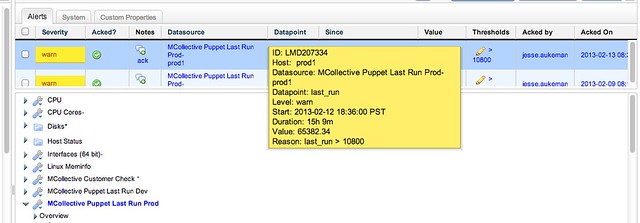
All of our hosts are automatically added to the Mcollective registration, and thus are also automatically added to puppet last run monitoring. This gives us peace of mind that we will alway be notified if there are issues with puppet updates.


