Colmux - Finding Memory Leaks, High I/O Wait Times, and Hotness on 3000 Node Clusters
Todd had originally posted an entry on collectl here at Collectl - Performance Data Collector. Collectl collects real-time data from a large number of subsystems like buddyinfo, cpu, disk, inodes, infiniband, lustre, memory, network, nfs, processes, quadrics, slabs, sockets and tcp, all using one tool and in one consistent format.
Since then a lot has happened. It's now part of both Fedora and Debian distros, not to mention several others. There has also been a pretty good summary written up by Joe Brockmeier. It's also pretty well documented (I like to think) on sourceforge. There have also been a few blog postings by Martin Bach on his blog.
Anyhow, awhile back I released a new version of collectl-utils and gave a complete face-lift to one of the utilities, colmux, which is a collectl multiplexor. This tool has the ability to run collectl on multiple systems, which in turn send all their output back to colmux. Colmux then sorts the output on a user-specified column and reports the 'top-n' results.
For example, here's an example of the top users of slab memory from a 41 node sample:
> colmuxl -addr cn[10-50] -command "-sm" -column 5# Thu Aug 25 06:15:41 2011 Connected: 41 of 41# <-----------Memory----------->#Host Free Buff Cach Inac Slab Mapcn23 60G 0 174M 87M 109M 190Mcn28 60G 0 177M 89M 107M 177Mcn27 60G 0 186M 101M 105M 139Mcn24 60G 0 103M 48M 105M 175Mcn21 123G 0 43M 27M 105M 90Mcn17 123G 0 42M 27M 104M 48Mcn35 60G 0 102M 54M 104M 173Mcn25 60G 0 125M 63M 104M 176Mcn18 123G 0 42M 27M 103M 49Mcn36 60G 0 103M 54M 103M 135Mcn34 60G 0 76M 54M 103M 174Mcn31 60G 0 103M 54M 103M 174Mcn19 123G 0 42M 27M 102M 49Mcn32 60G 0 103M 54M 102M 135Mcn22 123G 0 43M 27M 102M 90Mcn30 60G 0 103M 54M 101M 176Mcn26 60G 0 110M 55M 101M 175Mcn20 123G 0 42M 27M 101M 49Mcn15 123G 0 42M 26M 100M 47Mcn14 123G 0 42M 26M 100M 54Mcn13 123G 0 42M 27M 100M 50M
Debugging a Memory Leak Across a 64 Node Cluster
In fact I used this very command to track down a very strange problem on a large cluster running the lustre file system. Several nodes were running slower than others and nobody knew why. I ran collectl on each, comparing virtually everything I could think of from cpu loads, to interrupts, context switches, disks, networks (both ethernet and infiniband) and other subsystems as well.
It wasn't until I stumbled on the fact that some machines were using a lot more slab memory that I tried unmounting/remounting lustre on them and sure enough, the slab sizes dropped and their performance immediately improved. Drilling down into the individual slab allocations with collectl I then discovered a single slab called ll_async_page seemed to be the culprit and digging deeper with google I discovered a known problem with lustre memory leaks. With this factoid in mind, I then could use colmux to identify all the top slab memory consumers and sure enough, a small number of them had significantly higher values than the bulk of the nodes.
Therefore, it was simply a matter of unmounting/remounting lustre on just those and the problem was resolved. While it didn't fix the memory leak problem, which is a slow one, it at least got the cluster operating at full efficiency for a couple of months when the process had to be repeated. This was an older version of lustre and so maybe the problem has been resolved.
Tracking Down High I/O Wait Times
I've also used colmux on a large disk farm to track down disks with high I/O wait times. The possibilities are limitless, but naturally the commands/columns you choose to look at are highly dependent on the problem you're trying to solve.
Finding a Hot Needle in a 2000+ Node Haystack
One other use that was pretty cool was a colleague used this with collectl's ability to monitor temperatures to track down 'hot' system on a 2000+ node cluster during a linpack run.
Reliving History
You can also change columns dynamically by typing in the column number or using the arrow keys (if you installed the perl module TermReadKey). You can even reverse the sort order!
Furthermore, if you have historical data you've collected over several days, you can instruct colmux to play it back and sort it. So let's say you had some sort of hang on the cluster yesterday at 2PM. Just play back ALL the data across all the nodes and look at the top processes or maybe the network or anything else that could cause a hang.
Take a Look
Anyhow, if you think this might be worth a look install collectl-utils and take it for a spin. If you havent' tried collectl yet, perhaps this would be a good reason to do so.
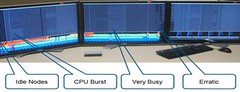
There is an alternative output format I call single line, in which a small number of columns are all reported on the same line, making it real easy to spot change. If you look at the bottom of the colmux page, there's a cool picture if monitoring close to 200 systems on a single line, of course it takes 3-30" monitors to see them all.