Hypertable Routs HBase in Performance Test -- HBase Overwhelmed by Garbage Collection
This is a guest post by Doug Judd, original creator of Hypertable and the CEO of Hypertable, Inc.
Hypertable delivers 2X better throughput in most tests -- HBase fails 41 and 167 billion record insert tests, overwhelmed by garbage collection -- Both systems deliver similar results for random read uniform test
We recently conducted a test comparing the performance of Hypertable (@hypertable) version 0.9.5.5 to that of HBase (@HBase) version 0.90.4 (CDH3u2) running Zookeeper 3.3.4. In this post, we summarize the results and offer explanations for the discrepancies. For the full test report, see Hypertable vs. HBase II.
Introduction
Hypertable and HBase are both open source, scalable databases modeled after Google's proprietary Bigtable database. The primary difference between the two systems is that Hypertable is written in C++, while HBase is written in Java. We modeled this test after the one described in section 7 of the Bigtable paper and tuned both systems for maximum performance. The test was run on a total of sixteen machines connected together with gigabit Ethernet. The machines had the following configuration:
OS: CentOS 6.1 CPU: 2X AMD C32 Six Core Model 4170 HE 2.1Ghz RAM: 24GB 1333 MHz DDR3 disk: 4X 2TB SATA Western Digital RE4-GP WD2002FYPS
The HDFS NameNode and Hypertable and HBase master was run on test01. The DataNodes were run on test04..test15 and the RangeServer and RegionServers were run on the same set of machines and were configured to use all available RAM. Three Zookeeper and Hyperspace replicas were run on test01..test03. The tables used in the test were configured to use Snappy compression (using native Snappy libraries for HBase) and Bloom filters loaded with row keys. We made every effort to tune HBase for maximum performance and details of the configuration we settled on can be found in the full test report Hypertable vs. HBase II. Instructions on how to setup and run this test can be found in Test Setup. The Java client API was used for both systems.
Random Write
In this test we wrote 5TB of data into both Hypertable and HBase in four different runs, using value sizes 10000, 1000, 100, and 10. The key was fixed at 20 bytes and was formatted as a zero-padded, random integer in the range [0..number_of_keys_submitted*10). The data for the value was a random snippet taken from a 200MB sample of the english Wikipedia XML pages. The following chart summarizes the results:
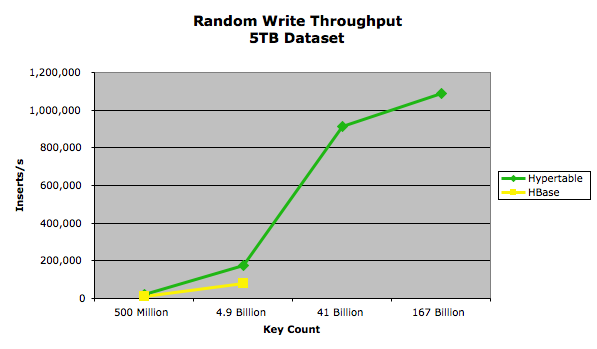
The exact performance measurements are provided in the following table.
| Value Size | Key Count | Hypertable Throughput MB/s |
HBase Throughput MB/s |
| 10,000 | 500,041,347 | 188 | 93.5 |
| 1,000 | 4,912,173,058 | 183 | 84 |
| 100 | 41,753,471,955 | 113 | |
| 10 | 167,013,888,782 | 34 |
The lack of data points for the HBase 41 billion and 167 billion key tests are due to the HBase RegionServers throwing Concurrent mode failure exceptions. This failure occurs, regardless of the configuration, when the RegionServer generates garbage at a rate that overwhelms the Java garbage collector (see Avoiding Full GCs in HBase with MemStore-Local Allocation Buffers for more details on this error). We believe that while it is possible to construct a garbage collection scheme to overcome these problems, it would come at a heavy cost in runtime performance. The paper Quantifying the Performance of Garbage Collection vs. Explicit Memory Management, by Matthew Hertz and Emery D. Berger, presented at OOPSLA 2005, provides research that supports this belief.
Random Read
In this test we measured the query throughput for a set of random read requests. Two tests were run on each system, one following a Zipfian distribution (modeling realistic workload) and another that followed a uniform distribution. Each inserted key/value pair had a fixed key size of 20 bytes and a fixed value size of 1KB. We ran two tests on each system, one in which we loaded the database with 5TB and another in which we loaded 0.5TB. This allowed us to measure the performance of each system under both high and low RAM-to-disk ratios. In the 5TB test, 4,901,960,784 key/value pairs were loaded and in the 0.5TB test 490,196,078 keys were loaded. The keys were ASCII integers in the range [0..total_keys) so that every query resulted in a match, returning exactly one key/value pair. Each test client machine ran 128 test client processes for a total of 512, and each test client issued queries in series so there was a maximum of 512 queries outstanding at any given time. A total of 100 million queries were issued for each test.
Zipfian
In this test, the set of keys queried followed a Zipfian distribution. We used an exponent value of 0.8, which means that 20% of the keys appeared 80% of the time. In this test, we configured Hypertable with a 2GB query cache. For the HBase test, we kept the block cache and memstore limits at their default values because that appeared to yield the best results. The results of this test are summarized in the following chart.
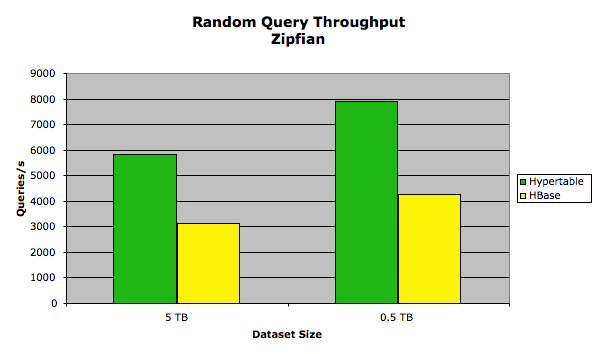
The exact performance measurements are provided in the following table.
| Dataset size | Hypertable Queries/s |
HBase Queries/s |
Hypertable Latency (ms) |
HBase Latency (ms) |
| 0.5 TB | 7901.02 | 4254.81 | 64.764 | 120.299 |
| 5 TB | 5842.37 | 3113.95 | 87.532 | 164.366 |
The performance discrepancy is due to the benefit provided to Hypertable by its query cache, a subsystem that is not present in HBase. HBase could implement a query cache, but it is a subsystem that generates a lot of garbage (in the write path), so we believe that while it may improve performance for some HBase workloads, it will have a detrimental impact on others, especially write-heavy and mixed workloads with large cell counts. One interesting thing to note is that when we increased the size of the block cache in both systems, it had a detrimental effect on performance. We believe that this is due to the fact that the systems had plenty of spare CPU capacity to keep up with the decompression demand. By eliminating the block cache, which stores uncompressed blocks, and relying on the operating system file cache, which stores compressed blocks, better performance was achieved because more of the data set could fit in memory.
Uniform
In this test, the set of keys queried followed a uniform distribution. The following chart summarizes the results:
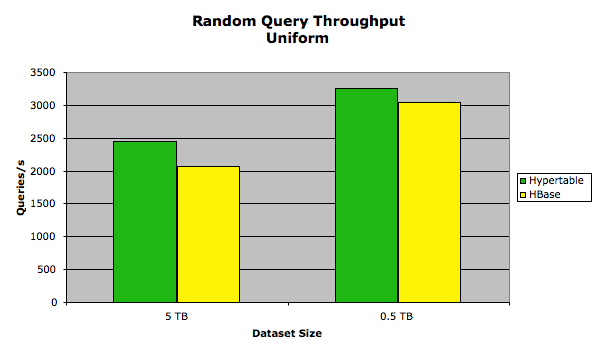
The exact performance measurements are provided in the following table.
| Dataset size | Hypertable Queries/s |
HBase Queries/s |
Hypertable Latency (ms) |
HBase Latency (ms) |
| 0.5 TB | 3256.42 | 2969.52 | 157.221 | 172.351 |
| 5 TB | 2450.01 | 2066.52 | 208.972 | 247.680 |
In this test, the HBase performance was close to that of Hypertable. We attribute this to the bottleneck being disk I/O and the minimal amount of garbage generated during the test.
Conclusion
The Hypertable community has been working hard over the past five years to build Hypertable into the winning high performance, scalable database solution for big data applications. We're excited by these results and continue to propel the project forward with new features and performance improvements. Hypertable is 100% open source software and we encourage you to join us and become a member of our community by clicking on the "Community" tab of the Hypertable website, www.hypertable.com.


