The Ultimate Guide: 5 Methods for Debugging Production Servers at Scale


This a guest post by Alex Zhitnitsky, an engineer working at Takipi, who is on a mission to help Java and Scala developers solve bugs in production and rid the world of buggy software.
How to approach the production debugging conundrum?
All sorts of wild things happen when your code leaves the safe and warm development environment. Unlike the comfort of the debugger in your favorite IDE, when errors happen on a live server - you better come prepared. No more breakpoints, step over, or step into, and you can forget about adding that quick line of code to help you understand what just happened. In production, bad things happen first and then you have to figure out what exactly went wrong. To be able to debug in this kind of environment we first need to switch our debugging mindset to plan ahead. If you’re not prepared with good practices in advance, roaming around aimlessly through the logs wouldn’t be too effective.
And that’s not all. With high scalability architectures, enter high scalability errors. In many cases we find transactions that originate on one machine or microservice and break something on another. Together with Continuous Delivery practices and constant code changes, errors find their way to production with an increasing rate. The biggest problem we’re facing here is capturing the exact state which led to the error, what were the variable values, which thread are we in, and what was this piece of code even trying to do?
Let’s take a look at 5 methods that can help us answer just that. Distributed logging, advanced jstack techniques, BTrace and other custom JVM agents:
1. Distributed Logging
For every log line we print out, we need to be able to extract the full context to understand what exactly happened there. Some data might come from the logger itself and the location the log is created in, other data needs to be extracted at the moment of the event. One caveat to avoid here is hurting your throughput. The more context you draw out, the bigger performance hit you experience. To test this in practice we ran a benchmark and discovered 7 Logback tweaks to help mitigate this risk (naming the logger by the class name is my favorite one).
What context should you draw out?
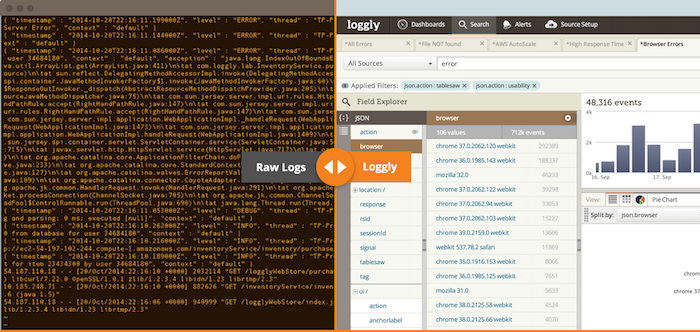
Everything! Where in the code are we, if relevant this can go down to the class we’re in, or even the specific method, which thread is this, and a self assigned transaction ID that’s unique to this request. A transaction ID is key to understanding the full context of an error, since it often travels between your nodes, processes and threads. A good practice to keep here is making sure you generate a UUID at every thread’s entry point to your app. Append the ID into each log entry, keep it for the tasks in your queue, and try to maintain this practice across your machines. We found this to be critical for making sense out of distributed or async logging. It becomes even more powerful when binded together with log management tools, like Logstash or Loggly, where you can search and tie the knots around the transaction from end to end.
When everything else fails - Catch ‘em all
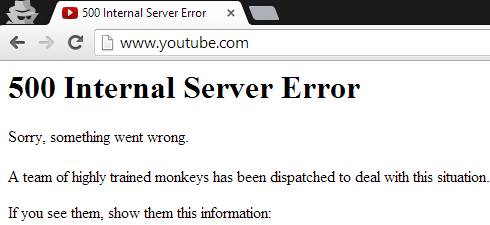
Uncaught exceptions are where threads go to die. And so does most of the evidence as to what actually happened there. Most of the time the framework you’re using will be able to contain this and show some error message (like YouTube’s custom message dispatching a team of highly trained monkeys to the rescue). For your own way to handle this, the last line of defense would be setting up a Global Exception Handler, like this one in Java:
public static void Thread.setDefaultUncaughtExceptionHandler(
UncaughtExceptionHandler eh);
void uncaughtException( Thread t, Throwable e) {
logger.error(“Uncaught error in thread “ + t.getName(), e);
}
This is similar to the things Tomcat or a framework like Akka will give you. Here are 3 ways to extract even more data when an uncaught exception inevitably happens:
Thread names: A nifty little trick is to change your thread name according to the request you’re handling. For example, whenever you’re processing a certain transaction, append its ID to the thread’s name and remove it when you’re done.
Thread-local storage (TLS): A way to keep thread specific data - off the Thread object. You can put there anything that would help identify what went wrong once an error happens. Things like a transaction id, time, or username. Other than this data and the thread name, there’s nothing much you can save when reaching the Uncaught Exception Handler.
Mapped Diagnostic Context (MDC): Similar to the thread-local concept and coming at it from the logging angle, the MDC is part of logging frameworks like Log4j or Logback. It creates a static map at the logger level, and enables a few more advanced features other than TLS.
2. Preemptive jstack
Most of you Java developers are probably familiar with jstack, a powerful tool that comes with the JDK. In two sentences, it basically allows you to hook into a running process and output all the threads that are currently running in it with their stack trace, frames, either Java or native, locks they’re holding and all sorts of other meta data. It can also analyze heap dumps or core dumps of processes that already don’t exist, a longstanding and super useful toolkit.
BUT… One of the issues it has is that it’s mostly used in retrospect, the bad awful thing has already happened and we’re firing up jstack to recover any clues of what might have caused it. The server isn’t responding, the throughput is dropping, database queries taking forever: A typical output would be a few threads stuck on some nasty database query. No clue of how we got there.
A nice hack that would allow getting the jstack output where it matters most would be activating it automatically when things go south. For example, say we want to set a certain throughput threshold and get jstack to run at the moment it drops:
public void startScheduleTask() {
scheduler.scheduleAtFixedRate(new Runnable() {
public void run() {
checkThroughput();
}
}, APP_WARMUP, POLLING_CYCLE, TimeUnit.SECONDS);
}
private void checkThroughput()
{
int throughput = adder.intValue(); //the adder is inc’d when a message is processed
if (throughput < MIN_THROUGHPUT) {
Thread.currentThread().setName("Throughput jstack thread: " + throughput);
System.err.println("Minimal throughput failed: executing jstack");
executeJstack(); // See the code on GitHub to learn how this is done
}
adder.reset();
}
3. Stateful jstack
Another issue with jstack is that while it provides very rich meta data about the thread, we’re lacking the actual state that led to the error. This is where manually setting the thread name comes to our rescue again. To be able to understand the source of the error, we need more than just a stack trace. Let’s go back to the nasty database query example, by adding a line like:
Thread.currentThread().setName(Context + TID + Params + current Time, ...);
What once looked like this in jstack’s output and didn’t provide much actionable data:
“pool-1-thread-1″ #17 prio=5 os_prio=31 tid=0x00007f9d620c9800 nid=0x6d03 in Object.wait() [0x000000013ebcc000]
Now looks like this:
”Queue Processing Thread, MessageID: AB5CAD, type: AnalyzeGraph, queue: ACTIVE_PROD, Transaction_ID: 5678956, Start Time: 10/8/2014 18:34″ #17 prio=5 os_prio=31 tid=0x00007f9d620c9800 nid=0x6d03 in Object.wait() [0x000000013ebcc000]
Now we have a better sense of what’s going on. You see what the thread was doing and the parameters it received, including the Transaction ID and Message ID. With these parameters the state that led us here becomes clearer. Now we know which message got us stuck, and can retrace our steps back, reproduce the error, isolate and solve it.
4. BTrace - An Open Source tracing tool
The next piece of the puzzle is better visibility into the state of a JVM at runtime. How can we get this kind of data about the state of our JVM without logging and code changes?
One interesting way to tackle this is by using the BTrace Java agent (You can find out more about what Java agents are and what’s the difference between them to native agents right here. BTrace lets us extract data from a running JVM without adding logging or restarting anything. After attaching the agent, you can hook up to it using the BTrace scripting language. Through scripting, you can instrument the code and grab data that runs through it.
Let’s take a look at some code to get a feel of what the scripting language looks like:
@BTrace public class Classload {
@OnMethod(
Clazz=”+java.lang.ClassLoader”,
method=”defineClass”,
location=@Location(Kind.RETURN)
)
public static void defineClass(@Return class cl) {
println(Strings.strcat(“loaded ”, Reflective.name(cl)));
Threads.jstack();
println(“==============================”);
}
}
Pretty similar to Java, right? Here we’re grabbing all the ClassLoaders and their subclasses. Whenever “defineClass” returns, the script will print out that the class was loaded and run jstack for us.
BTrace is a useful tool for investigating specific issues but it’s not recommended to use it continuously in production. Since it’s a Java agent with a high level of instrumentation, the overhead could often be significant. It also requires writing specific scripts for anything you’d like to measure and has many restrictions to avoid high overhead and not mess up anything important. For example, it cannot create new objects, catch exceptions, or include loops. With all that, it’s pretty cool to be able to edit scripts during runtime without having to restart your JVM.
5. Custom JVM Agents
While pinpointing the pieces of data we need for debugging is a good practice for logging, JVM agents have much more power and less to almost no extra plumbing requirements. To extract variable values for debugging without any code changes to your server, you need an agent in place. Smart use of agents can practically go around the other methods and serve you most of the data you need for debugging in high scalability.
Like BTrace, you can write your own custom Java agent. One way this helped us was when a certain class was instantiating millions of new objects for some reason, what we did to debug this was write a simple Java agent. The agent would hook to the constructor of that object and anytime the object was allocated an instance, it would get its stack trace. Later we analyzed the results and understood where the load was coming from. This is something BTrace couldn’t help us with since it has many restrictions and can only read data, and here we needed to write to file, log and do other operations that it doesn’t support.
If you’d like to get a feel for how an agent works, here are the few lines that get the whole thing rolling:
private static void internalPremain(String agentArgs, Instrumentation inst) throws IOException {
….
Transformer transformer = new Transformer(targetClassName);
inst.addTransformer(transformer, true); // the true flag let’s the agent hotswap running classes
}
A transformer object is created and we register it to the instrumentation object that has the power to change classes. The transformer implementation and the agent’s full source code, are available on GitHub.
The Native Agent and Variable Data
Unlike Java agents, native agents go a step deeper: They’re written in platform dependant native C/C++ code. Java agents have access to the code Instrumentation API, while Native Agents can also access the JVM’s low-level set of APIs and capabilities (JVMTI). This includes access to JIT compilation, GC, monitoring, exceptions, breakpoints and more.
At Takipi, we’re building a next generation production debugger that’s based on a native agent. It requires no code or configuration changes and it’s optimized to run on large scale production systems. Takipi analyzes your caught exceptions, uncaught exceptions, and log errors, showing you the exact state that led there down to the variable level. After attaching the agent to your JVM, you’ll be able to see your errors as if you were there when it happened:
Conclusion
It all boils down to this, the more valuable data you have, the quicker it is to solve the problem. Today when a few extra minutes of downtime are more valuable than ever, the drive to build rather than fix bugs is stronger, and the ability to quickly deploy new code without concerns is essential to succeed: A sound production debugging strategy must be in place.


