Performance Tuning Apache Storm at Keen IO

Hi, I'm Manu Mahajan and I'm a software engineer with Keen IO's Platform team. Over the past year I've focused on improving our query performance and scalability. I wanted to share some things we've learned from this experience in a series of posts.
Today, I'll describe how we're working to guarantee consistent performance in a multi-tenant environment built on top of Apache Storm.
tl;dr we were able to make query response times significantly more consistent and improve high percentile query-duration by 6x by making incremental changes that included isolating heterogenous workloads, making I/O operations asynchronous, and using Storm’s queueing more efficiently.
High Query Performance Variability
Keen IO is an analytics API that allows customers to track and send event data to us and then query it in interesting ways. We have thousands of customers with varying data volumes that can range from a handful of events a day to upwards of 500 million events per day. We also support different analysis types like counts, percentiles, select-uniques, funnels, and more, some of which are more expensive to compute than others. All of this leads to a spectrum of query response times ranging from a few milliseconds to a few minutes.
The software stack that processes these queries is built on top of Apache Storm (and Cassandra and many other layers). Queries run on a shared storm cluster and share CPU, memory, IO, and network resources. An expensive query can easily consume physical resources and slow down simpler queries that would otherwise be quick.
If a simple query takes a long time to execute it creates a really bad experience for our customers. Many of them use our service to power real-time dashboards for their teams and customers, and nobody likes to wait for a page while it's loading.
Measuring Query Performance Variability
Given that some queries do many magnitudes more work than others, how do we go about guaranteeing consistent response times?
Before we could answer this question, we needed to know the extent of the problem, so we came up with metrics that would define the problem clearly and help us measure progress as we made improvements.
We created a client application that queried our API with a fairly simple query. We monitored results closely and found that there was a big variation in response times at the 99th percentile. We then went on to define internal criteria that included different kinds of queries that were more representative of our customer traffic, instead of a single test query.
These were queries that represented the median size of data or lower. About 20% of all queries fell into this category.
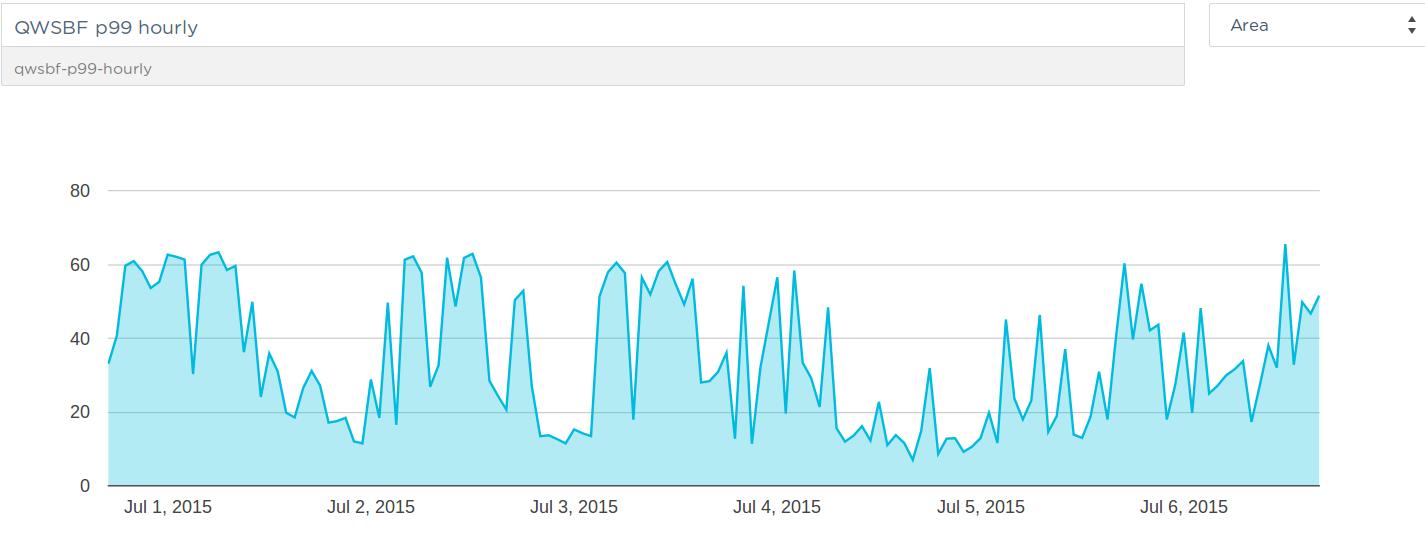
P99 for simple queries: one in a hundred queries were taking up to 60 seconds to execute - clearly we had a big problem!
Identifying How to Make Improvements
Once we had a way to measure performance variability we started thinking about how to tackle this.
We came up with a couple of high level goals:
- Reduce variability as much as possible in the type of work that a single storm worker (i.e. JVM) was doing.
- Within a JVM, prevent a single incoming request from consuming all of the most precious resources.
A Note About Incremental Progress
As engineers, we have a tendency to look at a complex software systems and immediately see all the problems with them. At this point we asked ourselves questions like: Is Storm even the right platform for doing this? Should we just rewrite the query execution service?
While our system was not perfect, big changes are disruptive and come with their own operational and performance problems which take time to tune. So we took the approach of small incremental goals instead of a big disruptive change.
Improvement: Reducing Variability by Isolating Workers
When I started working on this problem we were running a single Storm cluster that ran multiple topologies doing different kinds of work, ranging from executing queries to ingesting events into our data store and even streaming data to S3. The first thing we did was to create separate Storm clusters. We now run five different clusters across two DCs where each cluster runs a related set of topologies, including two dedicated clusters for processing queries in each DC.
The next step was to examine the distribution of workers on our Storm cluster. Our query topologies are built on top of Storm's concept of Distributed RPC. Each of these topologies can independently handle multiple concurrent client requests, where each request behaves like an RPC call to a caller.
By default Storm distributes workers (JVMs) for each topology across the cluster. Storm 0.8.2 added the Isolation Scheduler which makes it possible to 'isolate' topologies to a set of machines. We couldn't use the Isolation Scheduler directly because of our deployment infrastructure so we ended up writing our own scheduler that distributes workers in a similar fashion. We also built some additional features like the ability to change the isolation configuration dynamically.
The following diagram illustrates this.
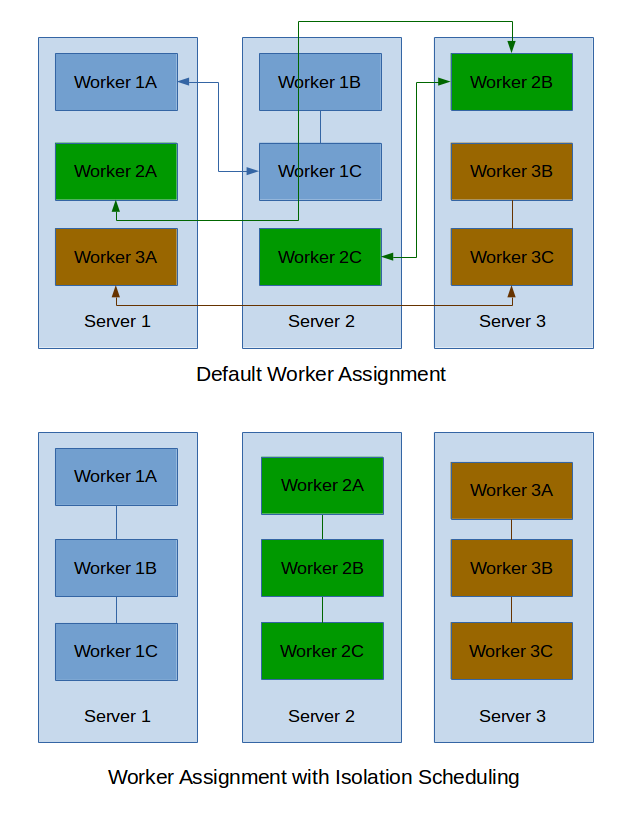
We further went on to reduce our query topologies to a single worker per topology which performed better in our testing.
Impact
This adjustment reduced the overhead of serialization and traffic between different workers, which in turn reduced overall storm CPU and gave us a performance boost.
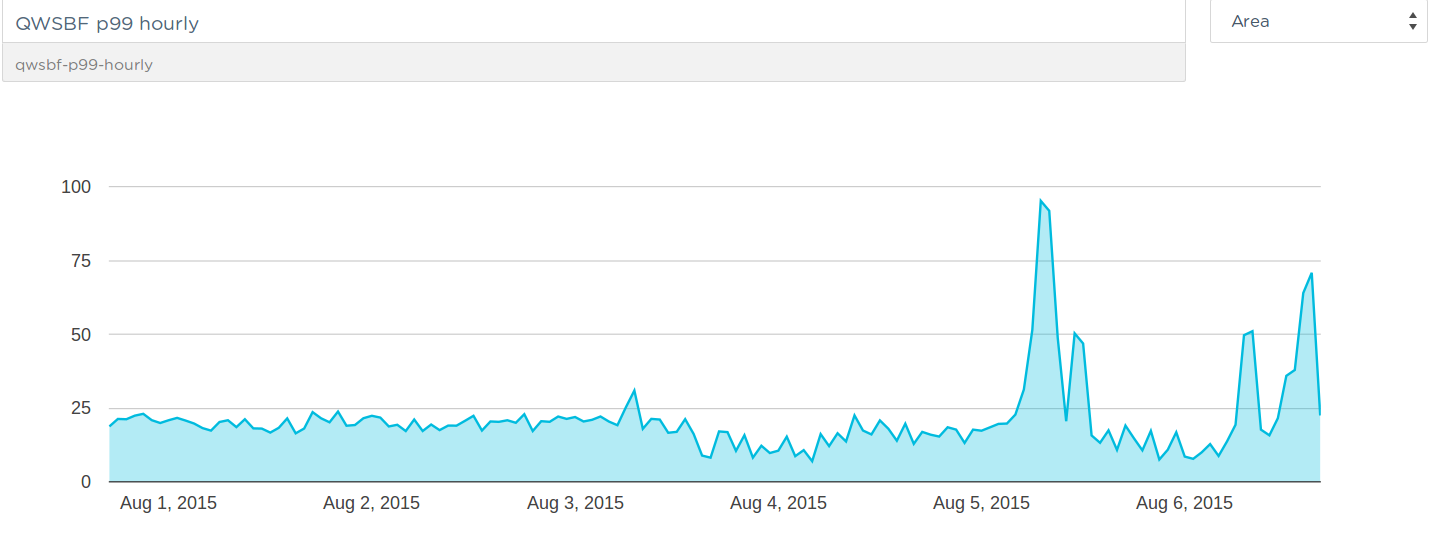
P99 for simple queries: we were still getting some nasty spikes but there was a big improvement. One in a hundred queries were now taking close to 25 seconds instead of 60 as before.
Improvement: Better Sharing of Resources by Making I/O Operations Asynchronous
Once we had isolation to a point where each JVM was executing a small number of concurrent queries we started profiling the code more aggressively. This immediately led us to a problem: the slowest operation in query execution was reading data from our distributed storage layer, which included a caching layer (Memcached) and a distributed database (Cassandra). Queries that required lots of reads from a database would consume the I/O pipeline and make other requests wait until resources were freed.
In Storm, the execution of business logic happens within Bolts. More specifically inside the ‘execute’ method of each bolt class.
Storm's design promotes doing all I/O operations inside the 'execute' method. While this works great to maximize throughput, it was causing slowdowns for simpler queries in our case.
Here's a simplified view of the execution of the I/O-hungry bolt in our initial design:
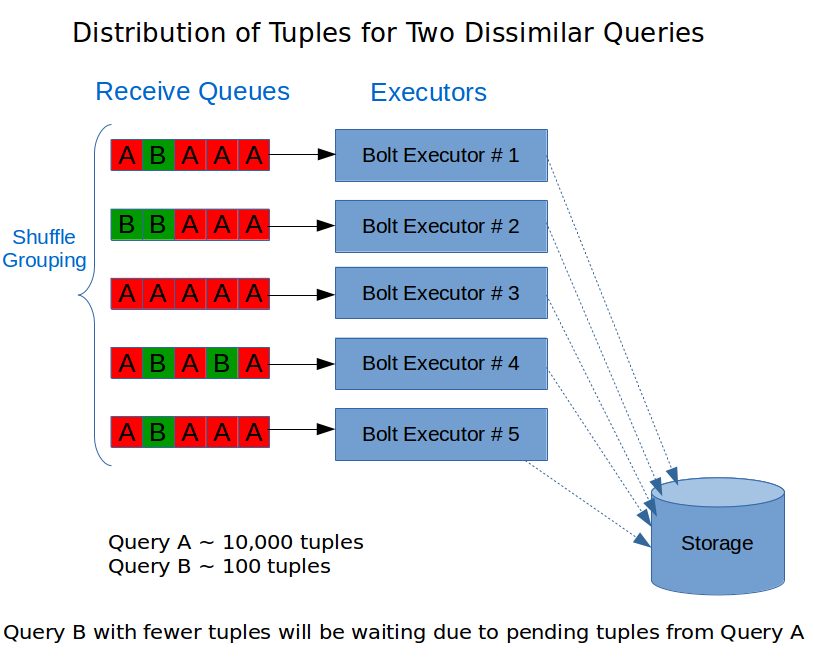
Note that with shuffle-grouping the tuples were distributed across multiple queues. In the above example a query with large number of tuples fills up the queue and another query with fewer tuples gets queued up behind the already pending tuples.
Some large queries required 100,000+ read operations to be performed, whereas simpler ones had a few hundred. This caused execution times to be highly variable depending on what queries were in-flight at that time.
Solving this problem was hard, especially within the execution environment that Storm provided. This was another why are we using Storm for this? moment.
While shuffle-grouping seems to be the problem here, if we got rid of it completely then the overall throughput would suffer because we would lose concurrency.
We tried using fields-grouping, which uses a hash function to determine how tuples get assigned to executors. By hashing on the 'request-Id' it would make all the tuples for a query hit the same bolt executor. (Each executor in Storm is a separate thread.)
There were still a few problems with** this approach:
- If all tuples for a query went to a single executor we would lose concurrency in our query processing. This means that queries would become slower overall.
- If there were a hash collision then a simpler query might get assigned to the same executor that was processing an expensive query.
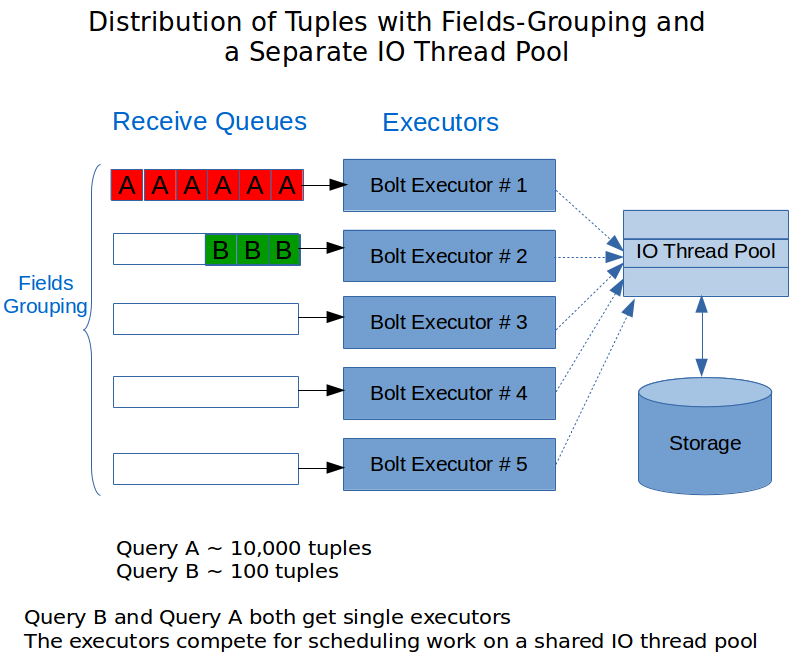
We came up with a solution after trying a few different things. We continued to use Fields Grouping but decided to create a separate shared thread pool for the actual I/O operations. This meant that the job of the bolt was now only to schedule an I/O operation on a thread pool which would be executed asynchronously.
In theory this was great, but because we were using a DRPC topology in Storm, we relied on the CoordinatedBolt for managing ACKs and keeping track of when a step in the query was fully complete. Unfortunately, the CoordinatedBolt doesn't work with code that is asynchronous and we started seeing exceptions when trying to use it this way. The following email thread talks about a similar problem that another developer experienced. https://groups.google.com/forum/#!topic/storm-user/u3I1W9Dj8-A
We had to work around this and the final scheme we came up with had a few changes.
- Use fields-grouping on request-Id
- Convert the Bolt to implement the BaseBatchBolt interface.
- Use a shared thread pool (shared across the JVM) to execute I/O operations.
- Use KeyedFairBolt to prevent hash collisions from starving execution of a query.
The new configuration looked something like the following diagram:
An important learning here was to not have a separate queue for the I/O thread pool. Trying to add more queueing using the traditional LinkedBlockingQueue caused our performance to tank. We realized that the overhead of blocking queues in Java is pretty significant and that is exactly the problem that the LMAX Disruptor used by Storm for queueing internally is designed to prevent.
This means we use the thread pool as a buffer of extra I/O threads. If there are threads available on the thread pool an operation gets scheduled; otherwise the calling thread blocks and tries to execute the operation itself. This way we rely on the queueing that Storm provides via the receive queues and it also acts as a simple back pressure mechanism when there are too many I/O operations in-flight.
The Impact
The async I/O changes led to a dramatic improvement that was immediately visible.
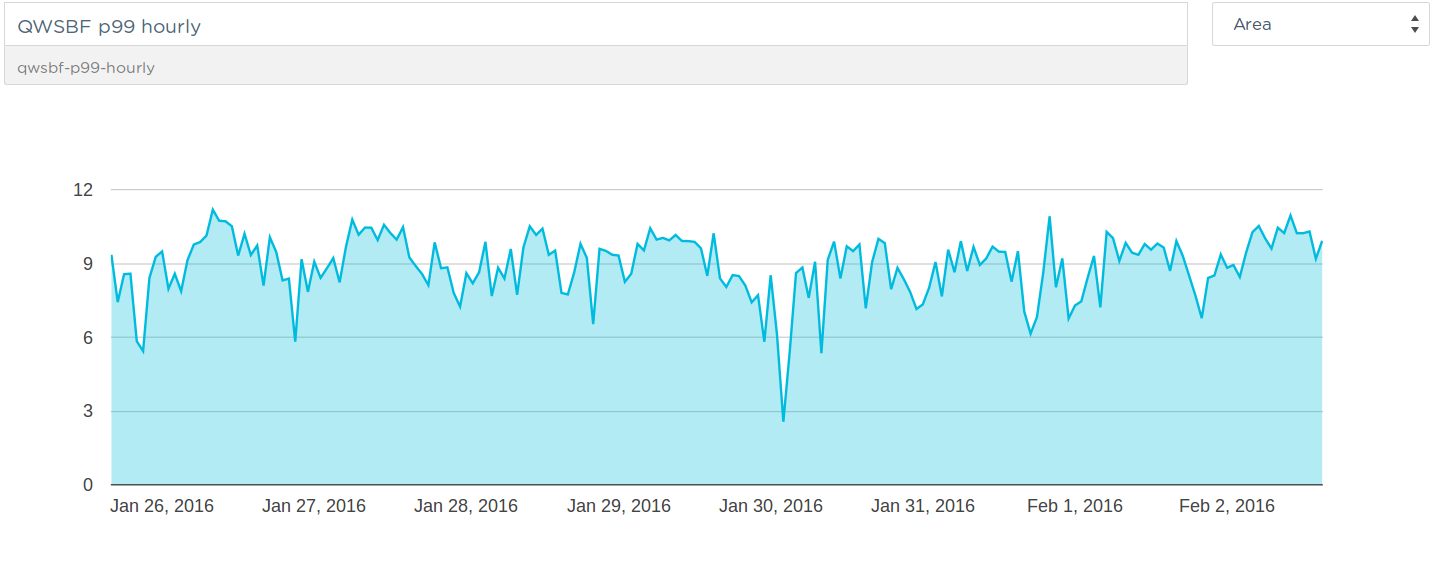
P99 for simple queries: Since we’ve deployed the change queries now take around 10 seconds or lower and are much more consistent over time.
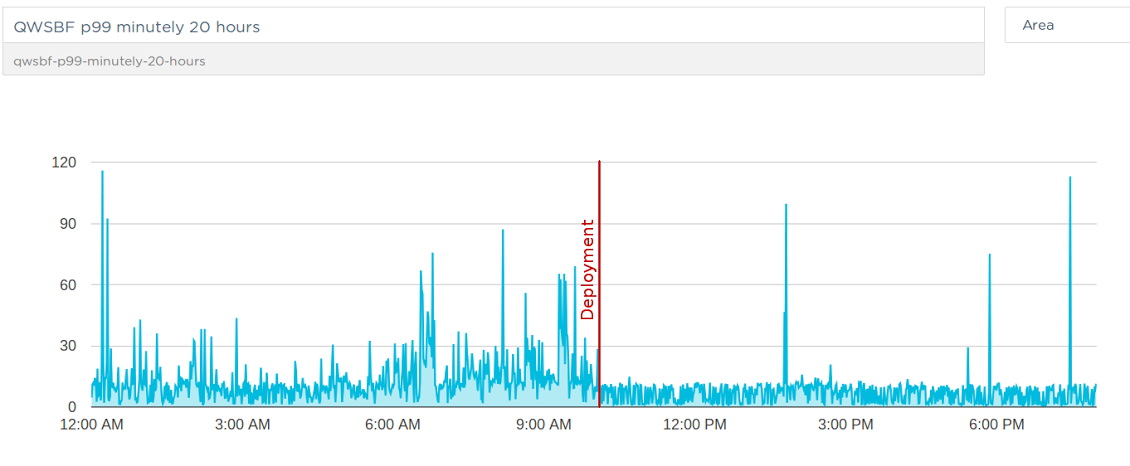
Here's a finer-grained version of the same metric showing minutely data (instead of hourly) and the change after the deployment.
This was a big milestone for us. In the past we’ve been able to make multiple improvements in overall query response times but we’ve struggled with the particular problem of how to keep response times consistent for all kinds of queries.
What’s Next
I would like to end by saying that we’re not done yet. We are continuing to invest in improving consistency of response times even further. We've also introduced query caching, which enables sub-second response times for queries of any size. This is especially helpful for our customers building customer-facing analytics into their product.
An idea that we’ve started exploring to improve consistency of response times for real-time queries is to build a query ‘weight’ prediction service. Something that will allow us to predict the complexity of a query before it is executed.
We could use information like the size of the dataset being queried, historic response times, or even machine learning to come up with a ‘weight’ for every query. We could then use that to assign the query to an appropriate queue.
While we don't have a true query weight prediction service just yet, we've gone ahead and partitioned our Storm topologies into three groups: small, medium and large, each with its own queue. At the moment we rely on historical data for query response times per project to decide what queue a query should be assigned to.
This has already given us the ability to separate the most expensive and the least expensive customer queries to a reasonable degree. More on this to come.
Thanks for reading! As always we’d love to hear from you. You can ping us on Slack or email us


