Evolution of data structures in Yandex.Metrica
Yandex.Metrica is the world's second largest web analytics system. Metrica takes in a stream of data representing events that took place on sites or on apps. Our task is to process this data and present it in an analyzable form.

Processing the data in itself is not a problem. The real difficulty lies in trying to determine what form the processed results should be saved in so that they are easy to work with. During the development process, we had to completely change our approach to data storage organization several times. We started with MyISAM tables, then used LSM-trees and eventually came up with column-oriented database, ClickHouse. In this article I'll explain what led us to settle on this last option.
Yandex.Metrica was launched in 2008 and has now been running for more than nine years. Every time we changed our approach to data storage in the past it was because a particular solution proved inefficient: either there was insufficient performance reserve, or the solution was unreliable, or it used too many computational resources, or it just did not allow us to implement what we needed to.
The old Yandex.Metrica for websites has more than 40 "fixed" report types (for example, the visitor geography report), several in-page analytics tools (like click maps), Webvisor (which lets you study individual user actions in great detail), as well as the separate report constructor.
With the new Metrica and Appmetrica, you can customize every report instead of dealing with "fixed" types. You can add new dimensions (for example, in a search term report you can break data down further by landing page), segment and compare (between, let's say, traffic sources for all visitors vs. visitors from San Francisco), change your set of metrics, etc. The new system, therefore, demands a completely different approach to data storage than what we used earlier.
MyISAM
At its founding, Metrica was designed as an offshoot of Yandex.Direct, the search ads service. MySQL tables with MyISAM engine were used in Direct to store statistics and that was what we started with in Metrica. We used MyISAM to store "fixed" reports from 2008 to 2011.
Let me explain a bit about what kind of structure report tables should take when dealing with geography, for example. A report is put together for a specific site (or, more precisely, a specific Metrica counter identifier). This means that the primary key should contain the CounterID. The user can select arbitary report period. Storing data for every pair of dates wouldn't make sense, so data is saved for every date and then cumulated by query for the selected interval. Therefore, the primary key contains the date.
Data in the report is displayed for regions either as a list, or in the form of a tree comprised of countries, regions and cities. Thus it makes sense to put the RegionID in the primary key of the table and gather data into a tree on the application code side rather than on the database side.
Let's say we also want to consider the average session duration. This means that the table columns should contain the number of sessions and total session duration.
So the resulting table will have the following structure: CounterID, Date, RegionID -> Visits, SumVisitTime,… Now we'll take a look at what happens when we request a report. A SELECT query is made with the conditions WHERE CounterID = AND Date BETWEEN min_date AND max_date. In other words, the primary key range is read.
How is data actually stored on the disk?
A MyISAM table is comprised of a data file and an index file. If nothing was deleted from the table and the rows did not change in length during updating, the data file will consist of serialized rows arranged in succession in the order that they were inserted. The index (including the primary key) is a B-tree, where the leaves contain offsets in the data file. When we read index range data, a set of offsets in the data file is extracted from the index. Then the data file is read by this set of offsets.
Let's look at the real-life situation when the index is in RAM (key cache in MySQL or system page cache), but the data in it is not cached. Let's assume that we are using hard disks. The time it takes to read data depends on the volume of data that needs to be read and how many seek operations need to be done. The number of seek's is determined by the locality of data on the disk.
Metrica events are received in almost the same order in which they actually took place. In this incoming stream, data from different counters is scattered completely at random. In other words, incoming data is local by time, but not local by counter number. When writing to a MyISAM table, data from different counters is also placed quite randomly. This means that to read the data report, you will need to perform about as many random reads as there are rows that we need in the table.
A typical 7200 RPM hard disk can perform between 100 to 200 random reads per second. A RAID array, if used properly, can perform proportionally many more. One seven-year-old SSD can perform 30,000 random reads per second, but we cannot afford to keep our data on SSD. With this system, if we needed to read 10,000 rows for a report, it would take more than 10 seconds, which would be totally unacceptable.
InnoDB is much better suited to reading primary key ranges since it uses a clustered primary key (i.e., the data is stored in an orderly manner on the primary key). But InnoDB was impossible to use due to its slow write speed. If this reminds you of TokuDB, then read on.
We applied a few tricks to make MyISAM work faster when selecting the primary key range.
Table sorting. Because data must be updated incrementally, it's not enough to sort the table once, but sorting it each time is impossible. Nevertheless, this can be done periodically for old data.
Partitioning. A table is divided into a number of smaller primary key ranges. This is done in hopes that data from one partition will be stored more or less locally and queries for the primary key range will be processed faster. This method can be referred to a manual implementation of a clustered primary key. It does slow data insertion down a bit. However, in choosing the number of partitions, usually a compromise can be reached between insertion speed and reading speed.
Separation of data by generation. Under one partitioning scheme selects can slow down too much, under another — insertion speed. And both slow down when using an intermediary option. The solution to this problem is to divide data into a few separate generations. For example, the first generation we'll call operational data; this is where partitioning either takes place as data is inserted (time-wise) or doesn't take place at all. We'll call the second generation archive data; this is where partitioning takes place as data is read (by counter number). Data is transferred from generation to generation via a script, but not too frequently (e.g. once a day) and is read from all generations right away. This helps, but also creates a lot of difficulties.
These (and other) tricks were used in Yandex.Metrica for a while to make everything work.
Let's summarize the drawbacks of the previous system:
- locality of data on the disk is very difficult to support
- tables are locked during INSERTs
- replication is slow; replicas frequently lag
- data consistency following a hardware fault is not assured
- aggregates such as the number of unique users are very difficult to calculate and store
- data compression is difficult to use and works inefficiently
- indexes take up a lot of space and do not fit on the RAM completely
- data has to be sharded manually
- many calculations have to be made on the side of the application code after SELECT
- difficult in maintenance and operation
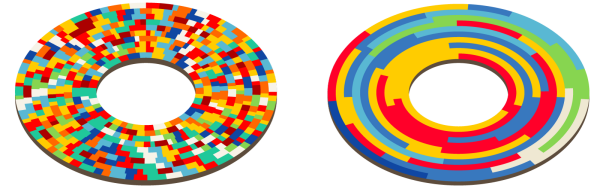
Image: locality of data on the disk (artistic rendering)
In summary, MyISAM was extremely inconvenient to use. In the daytime the servers worked with 100% load on disk arrays (constant head movement). In these conditions disks malfunction more than usual. We used disk shelves on the servers. In other words, we had to recover the RAID arrays pretty frequently. Sometimes replicas lagged so much that we needed to drop and recreate them. Switching replication master is really inconvenient.
Despite its drawbacks though, as of 2011, we stored more than 580 billion rows in MyISAM tables. Then everything was re-converted to Metrage, deleted, and a lot of servers were freed-up in the end.
Metrage and OLAPServer
We have been using Metrage for storing fixed reports since 2010. Suppose you have the following scenario:
- data is constantly written to the database in small batches
- the write stream is relatively large (at least several hundred thousand rows per second)
- there are comparatively few read requests (a few thousand queries per second)
- all reads of the primary key range (up to a millions of rows per query)
- rows are fairly short (around 100 bytes uncompressed)
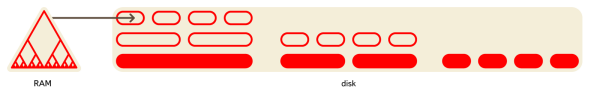
A fairly common data structure, LSM Tree, works well for this. This structure consists of a comparatively small group of data "chunks" on the disk, each of which contains data sorted by primary key. New data is initially placed in some type of RAM data structure (MemTable) and then written to the disk in a new, sorted chunk. Periodically a few sorted chunks will be compacted into one larger one in the background. This way a relatively small set of chunks are maintained.
This kind of data structures is used in HBase and Cassandra. Among embedded LSM-Tree data structures, LevelDB and RocksDB are implemented. Subsequently, RocksDB is used in MyRocks, MongoRocks, TiDB, CockroachDB and many others.
Metrage is also an LSM-Tree. Arbitrary data structures (fixed at compile time) can be used as "rows" in it. Every row is a key, value pair. A key is a structure with comparison operations for equality and inequality. The value is an arbitrary structure with operations to update (to add something) and merge (to aggregate or combine with another value). In short, it's a CRDT.
Both simple structures (integer tuples) and more complex ones (like hash tables for calculating the number of unique visitors or click-map structures) can serve as values. Using the update and merge operations, incremental data aggregation is constantly carried out at the following points:
- during data insertion when forming new batches in RAM
- during background merges
- during read requests
Metrage also contains the domain-specific logic we need that's performed during queries. For example, for region reports, the key in the table will contain the ID of the lowest region (city, village) and, if we need a country report, the country data will finish aggregating on the database server side.
Here are the main advantages of this data structure:
- Data is located pretty locally on the hard disk; reading the primary key range goes quickly.
- Data is compressed in blocks. Because data is stored in an orderly manner, compression works pretty well when fast compression algorithms are used (in 2010 we used QuickLZ, since 2011 - LZ4).
- Storing data sorted by primary key enables us to use a sparse index. A sparse index is an array of primary key values for each Nth row (N-order of thousands). This index is maximally compact and always fits on the RAM.
Since reading is not performed very often (even though lot of rows are read when it does) the increase in latency due to having many chunks and decompressing the data blocks does not matter. Reading extra rows because of the index sparsity also does not make a difference.
Written chunks of data are not modified. This allows you to read and write without locking - a snapshot of data is taken for reading. Simple and uniform code is used, but we can easily implement all the necessary domain-specific logic.
We had to write Metrage instead of amending an existing solution because there really wasn't one. LevelDB did not exist in 2010 and TokuDB was proprietary at the time.
All systems that implement LSM-Tree were suitable for storing unstructured data and maps from BLOB to BLOB with slight variations. But to adapt this type of system to work with arbitrary CRDT would have taken much longer than to develop Metrage.
Converting data from MySQL to Metrage was rather time consuming: while it only took about a week for the conversion program to work, the main part of it took about two months to work out.
After transferring reports to Metrage, we immediately saw an increase in Metrica interface speed. We've been using Metrage for five years and it has proved to be a reliable solution. During that time, there were only a few minor failures. It's advantages are its simplicity and effectiveness, which made it a far better choice for storing data than MyISAM.
As of 2015 we stored 3.37 trillion rows in Metrage and used 39 * 2 servers for this. Then we have moved away from storing data in Metrage and deleted most of the tables. The system has its drawbacks; it really only works effectively with fixed reports. Metrage aggregates data and saves aggregated data. But in order to do this, you have to list all the ways in which you want to aggregate data ahead of time. So if we do this in 40 different ways, it means that Metrica will contain 40 types of reports and no more.
To mitigate this we had to keep for a while a separate storage for custom report wizard, called OLAPServer. It is a simple and very limited implementation of a column-oriented database. It supports only one table set in compile time — a session table. Unlike Metrage, data is not updated in real-time, but rather a few times per day. The only data type supported is fixed-length numbers of 1-8 bytes, so it wasn’t suitable for reports with other kinds of data, for example URLs.
ClickHouse
Using OLAPServer, we developed an understanding of how well column-oriented DBMS's handle ad-hoc analytics tasks with non-aggregated data. If you can retrieve any report from non-aggregated data, then it begs the question of whether data even needs to be aggregated in advance, as we did with Metrage.

Image: query processing in column-oriented database
On the one hand, pre-aggregating data can reduce the volume of data that is used at the moment when the report page is loading. On the other hand, though, aggregated data doesn't solve everything. Here are the reasons why:
- you need to have a list of reports that your users need ahead of time
- in other words, the user can't put together a custom report
- when aggregating a lot of keys, the amount of data is not reduced and aggregation is useless
- when there are a lot of reports, there are too many aggregation options (combinatorial explosion)
- when aggregating high cardinality keys (for example, URLs) the amount of data does not decrease by much (by less than half)
- due to this, the amount of data may not be reduced, but actually grow during aggregation
- users won't view all the reports that we calculate for them (in other words, a lot of the calculations prove useless)
- it's difficult to maintain logical consistency when storing a large number of different aggregations
As you can see, if nothing is aggregated and we work with non-aggregated data, then it's possible that the volume of computations will even be reduced. But only working with non-aggregated data imposes very high demands on the effectiveness of the system that executes the queries.
So if we aggregate the data in advance, then we should do it constantly (in real time), but asynchronously with respect to user queries. We should really just aggregate the data in real time; a large portion of the report being received should consist of prepared data.
If data is not aggregated in advance, all the work has to be done at the moment the user request it (i.e. while they wait for the report page to load). This means that many billions of rows need to be processed in response to the user's query; the quicker this can be done, the better.
For this you need a good column-oriented DBMS. The market didn’t have any column-oriented DBMS's that would handle internet-analytics tasks on the scale of Runet (the Russian internet) well enough and would not be prohibitively expensive to license.
Recently, as an alternative to commercial column-oriented DBMS's, solutions for efficient ad-hoc analytics of data in distributed computing systems began appearing: Cloudera Impala, Spark SQL, Presto, and Apache Drill. Although such systems can work effectively with queries for internal analytical tasks, it is difficult to imagine them as the backend for the web interface of an analytical system accessible to external users.
At Yandex, we developed and later opensourced our own column-oriented DBMS — ClickHouse. Let's review the basic requirements that we had in mind before we proceeded to development.
Ability to work with large datasets. In current Yandex.Metrica for websites, ClickHouse is used to store all data for reports. As of September, 2017, the database is comprised of 25.1 trillion rows. It’s made up of non-aggregated data that is used to retrieve reports in real-time. Every row in the largest table contains over 500 columns.
The system should scale linearly. ClickHouse allows you to increase the size of cluster by adding new servers as needed. For example, Yandex.Metrica's main cluster has increased from 60 to 426 servers in three years. In the aim of fault tolerance, our servers are spread across different data centers. ClickHouse can use all hardware resources to process a single query. This way more than 2 terabyte can be processed per second.
High efficiency. We really focus on our database's high performance. Based on the results of internal tests, ClickHouse processes queries faster than any other system we could acquire. For example, ClickHouse works an average of 2.8-3.4 times faster on web analytics queries than one of top performing commercial column-oriented DBMS (let's call it DBMS-V).
Functionality should be sufficient for Web analytics tools. The database supports the SQL language dialect, subqueries and JOINs (local and distributed). There are numerous SQL extensions: functions for web analytics, arrays and nested data structures, higher-order functions, aggregate functions for approximate calculations using sketching, etc.
ClickHouse was initially developed by the Yandex.Metrica team. Furthermore, we were able to make the system flexible and extensible enough that it can be successfully used for different tasks. Although the database can run on large clusters, it can be installed on single server or even on a virtual machine.
ClickHouse is well equipped for creating all kinds of analytical tools. Just consider: if the system can handle the challenges of Yandex.Metrica, you can be sure that ClickHouse will cope with other tasks with a lot of performance headroom to spare.
ClickHouse works well as a time series database; at Yandex it is commonly used as the backend for Graphite instead of Ceres/Whisper. This lets us work with more than a trillion metrics on a single server.
ClickHouse is used by analytics for internal tasks. Based on our experience at Yandex, ClickHouse performs at about three orders of magnitude higher than ancient methods of data processing (scripts on MapReduce). But this is not a simple quantitative difference. The fact of the matter is that by having such a high calculation speed, you can afford to employ radically different methods of problem solving.
If an analyst has to make a report and they are competent at their job, they won't just go ahead and construct one report. Rather, they will start by retrieving dozens of other reports to better understand the nature of the data and test various hypotheses. It is often useful to look at data from different angles in order to posit and check new hypotheses, even if you don't have a clear goal.
This is only possible if the data analysis speed allows you to conduct instant research. The faster queries are executed, the more hypotheses you can test. Working with ClickHouse, one even gets the sense that they are able to think faster.
In traditional systems, data is like a dead weight, figuratively speaking. You can manipulate it, but it takes a lot of time and is inconvenient. If your data is in ClickHouse though, it is much more malleable: you can study it in different cross-sections and drill down to the individual rows of data.
After one year of open source, ClickHouse is now used by hundreds of companies worldwide. For instance, CloudFlare is using ClickHouse for analytics of DNS traffic, ingesting about 75 billion events each day. Another example is Vertamedia (a video SSP platform), which processes 200 billion events each day in ClickHouse with an ingestion rate of about 3 million rows per second.
Conclusions
Yandex.Metrica has become the second largest web-analytics system in the world. The volume of data that Metrica takes in grew from 200 million events a day in 2009 to more than 25 billion in 2017. In order to provide users with a wide variety of options while still keeping up with the increasing workload, we've had to constantly modify our approach to data storage.
Effective hardware utilization is very important to us. In our experience, when you have a large volume of data, it's better not to worry as much about how well the system scales and instead focus on how effectively each unit of hardware is used: each processor core, disk and SSD, RAM, and network. After all, if your system is already using hundreds of servers, and you have to work ten times more efficiently, it is unlikely that you can just proceed to install thousands of servers, no matter how scalable your system is.
To maximize efficiency, it's important to customize your solution to meet the needs of specific type of workload. There is no data structure that copes well with completely different scenarios. For example, it's clear that key-value databases don't work for analytical queries. The greater the load on the system, the narrower the specialization required. One should not be afraid to use completely different data structures for different tasks.
We were able to set things up so that Yandex.Metrica's hardware was relatively inexpensive. This has allowed us to offer the service free of charge to even very large sites and mobile apps, even larger than Yandex’s own, while competitors typically start asking for a paid subscription plan.


