R2l2ZSBNZWFuaW5nIHRvIDEwMCBCaWxsaW9uIEV2ZW50cyBhIERheSDigJQgVGhlIFNoaWZ0IHRv IFJlZHNoaWZ0

This is a guest post by Alban Perillat-Merceroz, from the Analytics team at Teads.
In part one, we described our Analytics data ingestion pipeline, with BigQuery sitting as our data warehouse. However, having our analytics events in BigQuery is not enough. Most importantly, data needs to be served to our end-users.
TL;DR — Teads Analytics big picture
In this article, we will detail:
- Why we chose Redshift to store our data marts,
- How it fits into our serving layer,
- Key learnings and optimization tips to make the most out of it,
- Orchestration workflows,
- How our data visualization apps (Chartio, web apps) benefit from this data.
Data is in BigQuery, now what?
Back to where we stopped in the previous article. Our data is stored in raw and aggregated formats in BigQuery. Our data analysts can query it directly for exploration or debugging purpose, but SQL has its limit. That’s where some Scala code takes over in our architecture, in a component we call the Analytics Service.
Analytics Service overview
The Analytics Service is a rather central piece that performs some operations and business logic that would be too complex to model as SQL. It also aggregates BigQuery’s data together with other data sources to enrich it. To be more specific, these operations involve:
- Access rights, so that users only get data they are authorized to see,
- Data hydration from dimension tables (our main business database),
- Advanced financial metrics calculation including exchange rates and business rules,
- Time zones management: we store data in UTC but allow users to request data in any time zone,
- Keeping track of which data is available or not and warn users that are pulling reports including partially available data,
- Trigger downstream jobs when data is available (including data marts).
The Analytics Service serves two rather different use cases with the same code and infrastructure:
- Spreadsheet reports (xlsx, csv) — They can be generated on demand, or scheduled. They are used a lot to follow specific business metrics on a daily basis.
- Data mart generation — Data marts are tailored views of the data and are used to build dashboards, serve as back-end for web apps, etc. Data marts can be configured to run either hourly (e.g. at ~08:30, generate data mart for period 07:00 to 07:59) or daily (e.g. at ~00:30, generate data mart for the previous day).
Because of BigQuery’s incompressible latency and additional processing involved to apply business rules, spreadsheet reports can take from 10 sec to a few hours to be computed. It all depends on the requested period and the complexity of the business rules implied by the requested data.
Technically, we offload processing of big reports as Spark jobs in order to isolate each process. Data marts are usually bigger than Spreadsheet reports and take more time to process.
Why Redshift?
Before we put Redshift in place, the Analytics Service processed Spreadsheet reports and SQL outputs that were loaded into an Infobright Enterprise Edition (IEE)* database.
*IEE is a proprietary fork of MySQL, modified for analytics (column-oriented). Although it was fine to use IEE to serve dashboards with Chartio (SaaS visualization app, that we use internally for Business Intelligence), we were reaching its limits, in terms of pricing and scalability.
We also had other data visualization needs within newly built web apps. On these apps, users can explore their data (e.g. a publisher can see his revenue, with many breakdowns: per hour, per device, per website, etc.). Low response time is a requirement as users expect an interactive experience. We set the requirement for any dashboard to load under 1s for these UIs.
With these two use cases in mind (Chartio for internal use and web apps for clients) we considered several options:
Option 1: BigQuery everywhere
We initially thought we could handle all this with BigQuery, by loading outputs of the Analytics Service back into BigQuery (instead of IEE). But doing this we ran into some limitations:
- BigQuery’s minimum latency is around 5s. That could have worked for Chartio and its built-in cache system, but it is much higher than what is acceptable for a web app.
- We were already approaching the maximum number of concurrent queries on BigQuery (Google allows up to 50 by default) without any data visualization app directly using it. With more and more web apps being developed we knew it would not scale.
Option 2: Keep data marts in IEE for Chartio and consider caching solutions for web apps
In order to work around latency and concurrency issues of BigQuery we naturally looked into caching solutions and benchmarked Key-Value stores. The short-listed candidates were DynamoDB and BigTable.
Both offer great read performance, but the challenge is on the write side. With BigQuery as the primary data source, a cache miss would cost too much, hence the need to pre-compute and load everything into a cache. This solution would add a lot of work beforehand, and would not help us move away from IEE.
A simplistic comparison of the candidates based on subjective evaluations. Greater is better.
As cache invalidation is one of the two hard things in computer science, we spent a lot of time assessing alternatives. An out-of-the-box proposition was Redshift.
It wasn’t intuitive, but we came to a point where we considered it was a serious candidate to solve two problems at once.
Option 3: The counterintuitive choice of Redshift
Redshift was a natural choice to replace IEE (products are similar on paper) and serve as a data source for internal Chartio dashboards.
But could Redshift be a serious alternative to low latency Key-Value stores for our web apps needs?
Redshift could indeed help reduce BigQuery’s load coming from Chartio, and we were also really tempted to make it fit our web apps needs. This way, we could mutualize the implementation effort.
We were immediately seduced by this solution for web apps as it comes with two great advantages:
- The data modelization would be the same as data marts for Chartio. The biggest difference would be the scope of each data mart. Whereas we use a few big data marts to power all Chartio dashboards, each specific use-case of web apps could require a dedicated data mart, so that it is optimized for it. The fact that the Analytics Service is already capable of generating these data marts makes the implementation easier.
- Redshift would offer more flexibility for web apps as SQL simplifies (a lot) data manipulation. This is especially true because we decided to handle the multi-tenant constraint at reach time, i.e. have one “cache” per application, rather than per application/user. We didn’t pursue the latter since the cardinality (number of users/rights-filtered “views”) is high. Also, having SQL on the consuming side would also make a future migration to another vendor/database easier since we wouldn’t have to rewrite all the dashboard/web app queries.
However, the scale of our data marts sits in between what the SQL world can handle and real Big Data. We have tables of a few billion rows and up to 600 GB of data per table. It’s enough for classic databases to start struggling, yet it’s the lower end of the spectrum for Redshift.
We still had the same two concerns though:
- Could Redshift achieve a low enough latency to serve interactive web apps?
- Would the query concurrency limit be sufficient for our use cases? The web apps we were building were advanced back-office apps, and we didn’t foresee more than a few thousands daily active users.
Concern #1 Query latency
Surprisingly, we found little information about how Redshift performs on relatively small data sets. All the benchmarks available at that time were focused on Big Data use cases. They naturally involved big clusters that would be overkill and economically challenging for our use case. These benchmarks were testing Redshift for large queries taking 10 to 30 seconds.
Without first-hand experience with small clusters and small optimized queries, we were incapable of knowing if Redshift could perform sub-second response times for our datasets.
Experience now tells us it is possible to serve an app with complex dashboards to a few concurrent users and keep latency under 500 ms, which is:
- Satisfying for a business app with asynchronous loading,
- Impressive for a table with 8 billion rows.
Here are a few practices and optimizations we follow to achieve this level of performance:
- Each app uses a dedicated Redshift cluster,
- Each section of the app gets a dedicated data mart, tailored for the need of this section,
- By knowing in advance all the queries we run against a data mart, we are able to choose the best sort key that will perform best with those queries,
- Sorting (
ORDER BY) is an expensive operation for Redshift. We achieved better performance by letting the app sort the data once it is fetched out of Redshift.
Redshift query duration (p90)
Concern #2 Query concurrency
Before taking a step into the unknown, we asked around people that had already tried to plug Redshift to a user-facing app. They all warned us and pointed out the concurrency limitations of Redshift. Concurrent queries limitations are similar or worse than BigQuery’s (50 slots maximum, 15 recommended).
We carried on anyway. It was a risky choice, but we bet on Redshift because:
- Our apps are essentially back offices with a limited number of users. Besides, a typical visit does not involve a lot of queries so we figured we had some headroom for the future,
- Our apps do not interfere with each other so, by having one cluster per app, we could isolate the load and multiply the total number of slots available for concurrent queries. Our strategy is to use several small and cheap Redshift clusters. This horizontal scaling, in number of clusters more than number of nodes, is made possible thanks to the entry price of Redshift: 180$/month for a cluster (on demand) and as low as 70$/month (3 year upfront). It’s also worth mentioning that the cluster mode includes a leader node that is free of charge. Pricing apart, we can functionally afford to have a cluster for each use case as data marts are tailored to be self-sufficient (no
JOINoperation necessary). We use Terraform to describe our infrastructure, which helps reduce friction and entropy when creating new clusters. - Anyway, investing in Redshift was still useful for our Chartio use case to replace IEE.
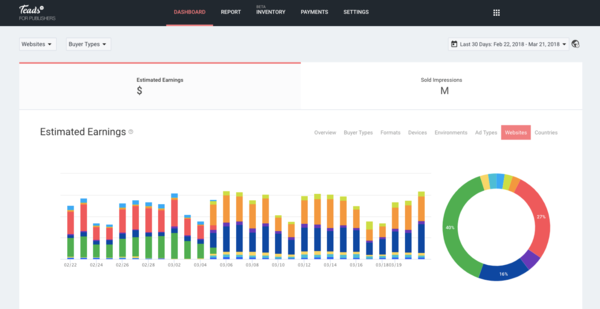
Teads for Publisher, one of the web apps powered by Analytics
Make the most out of Redshift — An optimization journey
Unlike BigQuery, Redshift requires a lot of manual optimizations to perform at his best. AWS manages hardware and clustering, but you are still responsible for many database options inherited from Postgres. Most of the optimization is done at the table level with many options to choose from (column type and encoding, sort keys, primary and foreign key, etc.) as well as maintenance operations (vacuum, vacuum reindex, analyse).
The Redshift documentation gives a good overview of the best practices (here, here, here and here). Here is what works for us:
Sizing
It’s the first thing you need to do when creating a cluster. We use the smallest SSD instances (dc2.large) and to date we have 5 Redshift clusters (from 3 to 18 dc2.large nodes each). We also have an “archive” cluster to store cold data, that we use for backups and ad hoc queries (4 ds2.xlarge HDD instances). It’s really easy to resize a cluster, so there is no need to do any complex capacity planning here.
Columns encoding
Compression is first and foremost about performance but reducing table footprint is always welcome. All you need to know about encoding is in the documentation. After running some benchmarks on our data, the best configuration for us is:
DELTA32KforBIGINTmetrics,LZOforNUMERICmetrics, overall,LZOgives the best compromise between query performance and compression in our experience,BYTEDICTfor dimensions where we know cardinality is < 255. It is 3% faster and 18% more compressed compared toTEXT255(alt. compression encoding for dictionaries).BYTEDICTsupports all types whereasTEXT255only supportsVARCHAR.LZOfor other dimensions,- No compression for any column in the sortkey.
Table example with columns encoding
In this example, we use the BYTEDICT encoding for the device column because we know the cardinality is 4 (mobile, desktop, tv, tablet), but we use LZO for the browser because there is a virtual infinity of user agents.
We’ve also compared general purpose algorithms LZO and ZSTANDARD. Although ZSTANDARD always gives the best compression ratio, it compromises on query performance. We end up never using it because of our focus on query performance. In this benchmark, DELTA encoding has even better read performance, but it is not compatible nor adapted to all types of data.
This chart is specific to our context, and only for illustration purpose. It gives a rough idea of the results of our early benchmarks comparing compression algorithms. x-axis is an index of query response time.
Sort keys
Sort keys are like indexes, it’s the most important performance lever. There are two types of sort keys:
- Compound: these are the most efficient, but they restrict how you should query the data.
sort key(hour, ad_id)will be performant when you discriminate onhour,hourandad_id, but notad_idonly. - Interleaved: these sort keys allow querying columns in any order, but compromise on read performance and greatly increase vacuum durations.
Vacuums and Analyse
Redshift doesn’t sort data on insertion nor moves data during deletions. Vacuums are maintenance operations that will defragment and sort tables. It is mandatory to maintain optimal performance. The 3 most important operations are:
- Vacuum: sort data and defragment deleted parts. We run it once a day, and it takes about 1h for a table with 3 billion rows (200GB). We run vacuums with a threshold of 100% to have optimal read performance,
- Vacuum Reindex: specific operation needed when using interleaved sort keys. This operation is very expensive (about 3–5x more than vacuums), so expensive it may be worth considering deep copy instead,
- Analyse: updates table statistics that are used by the query planner. A relatively cheap operation.
Scheduling vacuums is tricky as these are long, I/O intensive processes, and limited to a single concurrent vacuum operation per cluster. Vacuum Reindex operations are so demanding that we can’t do them on all tables every day, it would take more than 24 hours to process. It’s worth mentioning that during vacuums our clusters perform at about a third of their nominal capacities(which may be related to the fact we use small clusters).
At first, we tried to vacuum after every data load (every hour), to maximize performance. It did not prove to be a good idea, the servers were taking most of their time doing these costly operations, and performance reduction over the day without vacuum is negligible. Instead, we run a nightly custom script that loops over all tables in the cluster and performs these maintenance operations.
Queues & priorities
Redshift has advanced mechanisms to manage SLAs between users, but we kept all the default settings for now. The fact that we have a cluster per use-case simplifies this part.
We enabled Short Query Acceleration for a cluster that has a lot of concurrent queries (the one for Chartio). It automatically analyses queries and assigns shorter ones to a dedicated queue. It worked great to reduce the performance impact of larger queries.
Instance reservation
Like many AWS resources, Redshift instances are eligible to the reservation mechanisms. Reserving instances is a tedious but necessary task to reduce your bill. Fortunately, data marts fall into the permanent type of instances so it’s relatively easy to forecast minimum usage.
Key learnings working with Redshift
- Even though Redshift’s underlying infrastructure is managed by AWS, there is a lot of work needed to optimize and operate it. To give you an idea, we spend more time operating 100s of GB on Redshift than we do for 100s of TB on BigQuery,
- Adding more nodes is needed when tables become larger and/or with more querying traffic, but it does not necessarily increase performance for small tables (during our benchmarks, we didn’t see much difference when comparing
largeversus8xlargeinstances), - Concurrent queries limit (default 15, max 50) can be a problem for user-facing interactive apps,
- Loading data is fast, but you have to go through S3 and use the
COPYcommand, - Redshift is based on PostgreSQL 8: user and group access rights management is a hassle. Even the most basic thing like giving a user read-only access to all tables involves a lot of tedious operations. It actually discouraged us from giving our Data Analysts direct SQL access: we prefer BigQuery for that.
The evolution of Redshift
Redshift is an evolving product. This article mostly reflects Redshift as of early 2017. Some features and simplification are regularly released.
- Since January 2019 (Redshift version
1.0.5671),ANALYSEandVACUUM DELETEoperations are done automatically for you in the background. We can hope the other, more complexVACUUMandVACUUM REINDEXoperations will become unnecessary too. - In November 2018, Redshift introduced a new way to add or remove nodes faster. It is only available if you double or divide by two the number of nodes, but it takes minutes instead of hours.
- At re:Invent 2018, Redshift announced a Concurrency Scaling feature that would help with bursts of user activity. This should be available in the first half of 2019.
Orchestration and scheduling
Each step of our process, from Dataflow ingestion to data mart processing into Redshift, needs to be tightly orchestrated. We use good old Jenkins and jobHistory (an internal tool) to achieve that.
Most of our jobs process an endless write-only stream of data. The base unit of time is an hour and jobHistory acts as a timekeeper for all our jobs.
Basically, each job will have to process 24 of these chunks every day. For each job, jobHistory knows which chunk has been processed, and which hasn’t. It also keeps a dependency graph of jobs, so that each successful job can trigger downstream operations.
For each job, Jenkins polls jobHistory every few minutes and asks for dates to process. Most of the time there is nothing to do and once every hour it triggers the processing of this chunk.
jobHistory UI, grey hours are chunks that will be processed once parent dependencies are processed
We tried more advanced alternatives to jobHistory, such as Cloud Composer(based on Apache Airflow), but it didn’t fit well enough our need and lacked maturity at the time.
Jenkins, jobHistory: the ingredients are simple. The key to the reliability of the chain resides in a few good practices:
- All jobs are designed to be idempotent so you can run and re-run them with confidence (e.g. when they fail, or when late events occur for a chunk that was already processed).
- Writing data with atomic operations helps achieving idempotency. Real-life example: a Jenkins job A is tasked to create tableA by delegating the process to BigQuery. Let’s say the query takes longer than usual and the Jenkins job ends up with a timeout. At this point, we don’t know if the query succeeded. We can re-run job A with the same parameter, the job will first look for a tableA. Because BigQuery’s output is atomic, if the table is present, there is nothing to do.
- Writing data using upsert mechanisms (insert or update) is another way to be idempotent.
- Trust raw data more than housekeeping metadata. With the example above, to get the last processed table, you could rely on a metadata set by job A, or you can directly check if tableA exists. It is not always feasible (e.g. for performance reason), but it removes potential problems caused by discrepancies between data and metadata.
Conclusion
Two years after our first tests, Redshift has become a central piece of our Analytics stack: a database to rule all our various data visualization needs, from self-serve data exploration on Chartio to apps with latency constraints.
It packs a simple SQL interface with good performance and scalability at a reasonable price. Even if our hybrid use case is exotic, latency is acceptable for web UIs and we are still well under concurrency limits.
We couldn’t think of a better way to show our results than a quick overview or our Data Visualization apps:
Here is one of our web apps
Chartio dashboard (example)
If you like large scale event processing and Analytics related challenges,give us a shout. We are actively looking for Engineers to build tomorrow’s architecture.
Many thanks to Benjamin Davy, Brice Jaglin, Christophe Oudar, Eric Pantera for their feedback on this article and Teads’ Analytics team for their contribution to the technology behind all this: Dimitri Ho, Nathan Marin, Olivier Abdesselam, Olivier Nouguier, Quentin Fernandez, Roch Dardie.


