How ShiftLeft Uses PostgreSQL Extension TimescaleDB

This article is written by Preetam Jinka, Senior Infrastructure Engineer at ShiftLeft. Originially published as Time Series at ShiftLeft.
Time series are a major component of the ShiftLeft runtime experience. This is true for many other products and organizations too, but each case involves different characteristics and requirements. This post describes the requirements that we have to work with, how we use TimescaleDB to store and retrieve time series data, and the tooling we’ve developed to manage our infrastructure.
We have two types of time series data: metrics and vulnerability events. Metrics represent application events, and a subset of those that involve security issues are vulnerability events. In both cases, these time series have some sort of ID, a timestamp, and a count. Vulnerability events can also have an event sample that contains detailed information about the request that exercised a security vulnerability. In addition to those attributes, time series are also keyed by an internal ID we call an SP ID, which essentially represents a customer project at a certain version.
The data model for metrics is closely tied to the source-sink model of the Code Property Graph such that, for a given application, its methods, and I/O and data flows are organized into triggers, inputs, and outputs. This has been illustrated in the figure below which summarizes a few typical endpoints acting as triggers and the flows through which input data received at those endpoints eventually reach an output such as a log.We rarely query time series data for a single metric; usually we need to query for lots of metrics that are related according to this data model.
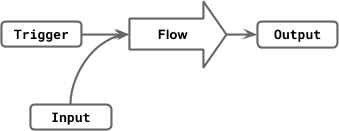
Visualization of a flow and its trigger, input, and output ends
Here are the requirements that we’ve had to work with for the implementation:
- Needs to work with Go because almost all of the runtime infrastructure is written in Go.
- Needs to fit in well with the rest of our development and testing environment. For example, our end-to-end (E2E) testing environment is implemented using Docker Compose so all databases need to be available as a Docker image.
- Has to support our rapid iteration workflow. We can’t be too tied down to a single data model as new features can change requirements.
- Needs to be manageable by a small team. We’re a startup with limited resources so it would be best to choose a technology that is familiar to a lot of people.
- Multiple granularity support and retention management so we can keep queries fast and costs low.
So far we’ve found that TimescaleDB is the best suited for these requirements. TimescaleDB is an open-source PostgreSQL extension that provides special tables called hypertables that behave like regular PostgreSQL tables but are partitioned into chunks under the hood. These chunks can be partitions of time as well as user-defined attributes. In our case we use SP ID as a partitioning column. This results in the the fast update and querying benefits of using several tables without the hassle of handling partitioning logic in your queries.
Our hypertables can have thousands of chunks. When we query for metrics for a given SP ID and time range, TimescaleDB filters out unnecessary chunks and only queries a small subset to execute the query. The other benefit of hypertables is we’re able to purge old data quickly by dropping chunks instead of running expensive DELETEs on large tables.
Finally, because we’re still working with PostgreSQL, we can leverage the development and operational experience we already have. We use other instances of PostgreSQL for some of our other SaaS data storage needs so we benefit from code reuse like Gaum. There are also plenty of monitoring solutions that support PostgreSQL out-of-the-box.
Infrastructure
Almost all of ShiftLeft is deployed with Docker containers on an orchestration system. This includes TimescaleDB. We also use the Docker image for testing, and have a comprehensive E2E testing suite that uses Docker Compose.
Most of the ShiftLeft runtime infrastructure is written in Go. Runtime metrics data from agents ends up at gateway instances which publish into a Kafka topic. On the other side, we have consumer instances which ingest and aggregate the metrics data and occasionally write to TimescaleDB in batches. The minimum granularity is 2s, and we also have 1m and 5m aggregation in the consumers. ShiftLeft also has 1h and 1d granularity, but this is handled with a batch process instead.
Rollups / Downsampling
We created a period downsampling job to support larger granularities without aggregating in memory. On ingest, we periodically update a metrics_downsampling_status table which stores downsampling tasks.
Example data in the metrics_downsampling_status table:
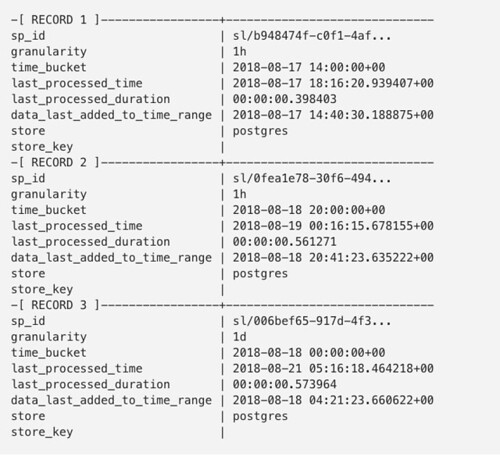
Entries get updated in this table at the same time as our 5m aggregation flush. When the downsampling task runs, which happens once an hour, it looks for unprocessed rows in the status table, aggregates 5m data into 1h and 1d granularity, and then updates the status table again.
Querying
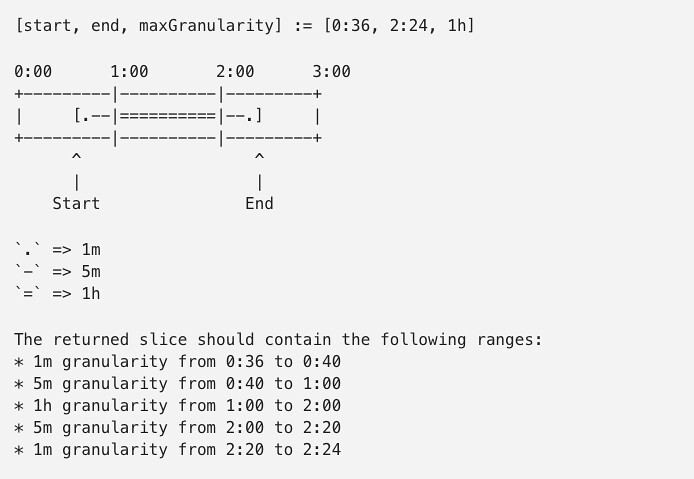
Our metrics API is written in Go, and it has logic to use the best granularity (or several) depending on the request. For example, requesting 60 points for a 5 hour interval means each point would be 5 minutes, so we can use our 5m granularity data. Anything smaller than a 5 hour range for 60 points means we have to use either 1m or 2s granularity. Aggregate counts (everything except charts) behave like charts but with 1 point.
Example of the granularity logic:
One issue we had with queries was that sometimes a lot of time was spent on planning. In one case, we saw a query take 17 seconds for planning but only 250 ms on execution. This problem went away with v0.10 which significantly improved chunk interaction for queries. You can read more about Timescale’s work on this improvement here.
Samples
Vulnerability events can have details about requests like the HTTP path and headers. Some of these events are sampled and stored as JSON using a JSONB column in a hypertable. This way we get the flexibility of using JSON and unstructured data and the operational benefits of hypertables.
Monitoring
We monitor requests, TimescaleDB, and related components in several ways. To monitor query performance, we use a mix of PgHero and application metrics. PgHero uses pg_stat_statements and provides a rough view of the top queries. In practice we usually don’t find it helpful because our queries tend to be fast and our request latency mainly comes from executing lots of these queries, not a single slow one. The majority of the time series metrics request monitoring is done with Prometheus metrics exposed by the API and Grafana for visualization.
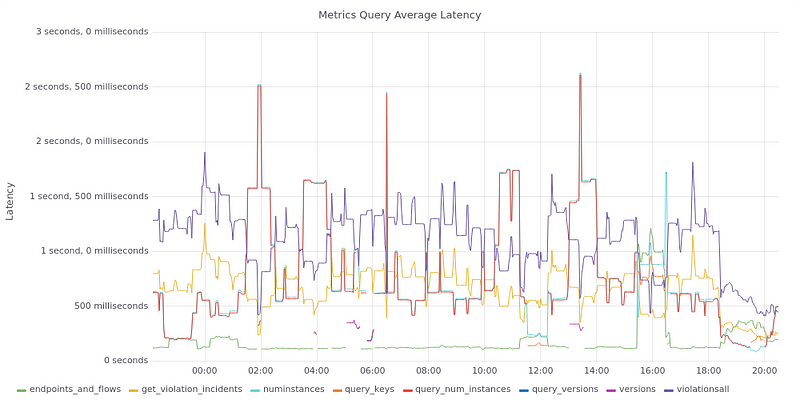
Average metrics latencies
In terms of ingest monitoring, we keep a close eye on DB write rates and latencies.
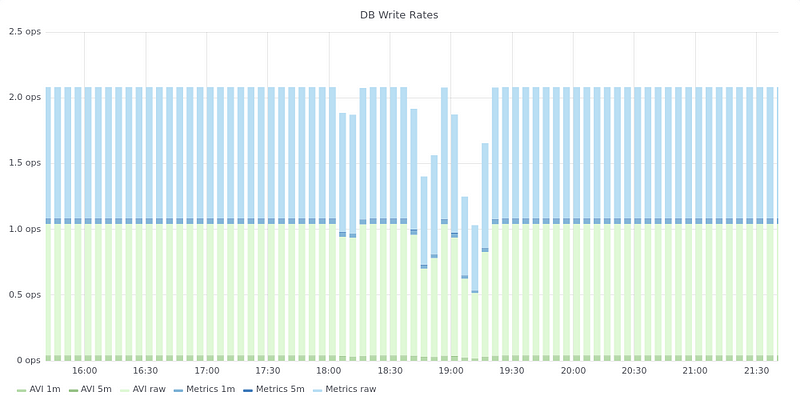
Database write rates
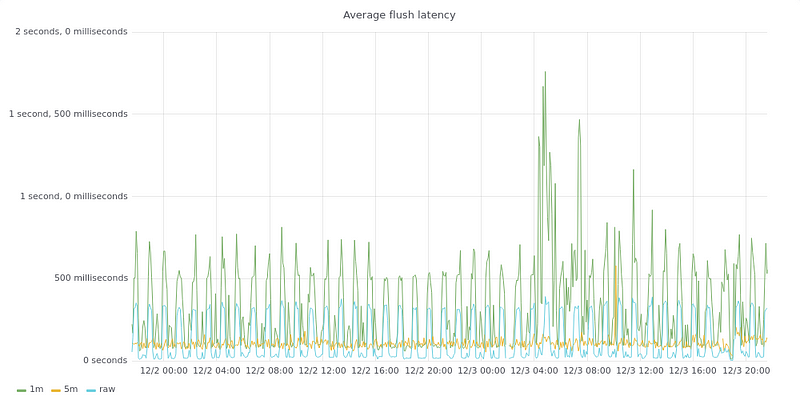
Average latency to flush metrics to TimescaleDB
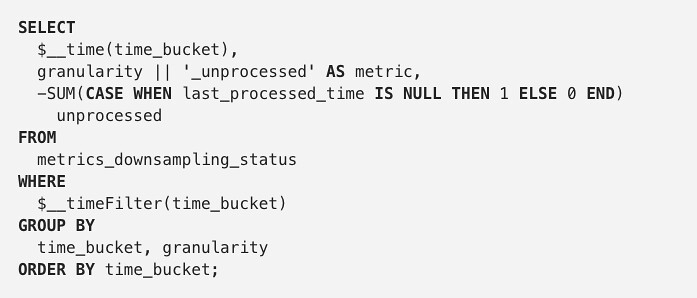
We also use Grafana extensively with PostgreSQL, but for operational purposes and not extracting time series from hypertables. Using the PostgreSQL data source option in Grafana, we can create visualizations based on queries against any PostgreSQL database. A couple of great examples are our downsampling charts. These use the metrics_downsampling_status table described earlier and let us keep an eye on pending work and processing times.
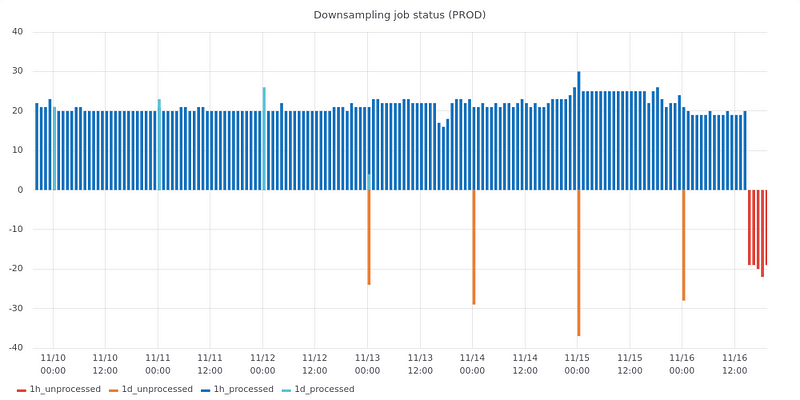
Monitoring the status of downsampling jobs using Grafana
Here’s what one of the SQL queries looks like for that Grafana chart:
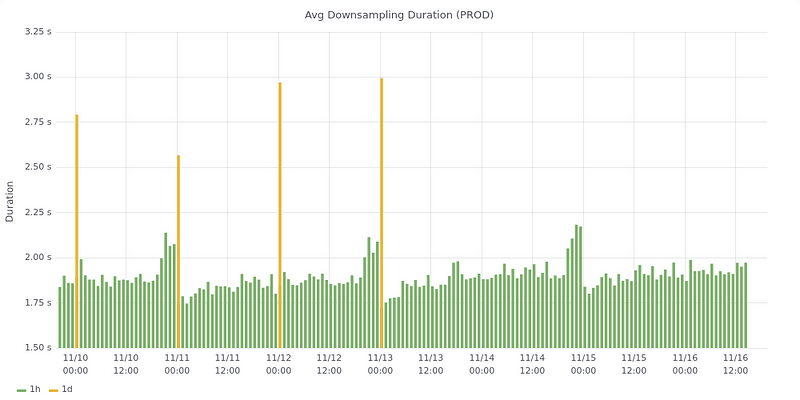
Average downsampling job latency
When you zoom out to a longer time period like 90 days, you can clearly see some interesting trends. In our case, our downsampling tasks are starting to take longer and longer. They’re still around 2 sec on average so we don’t have any problems (yet).
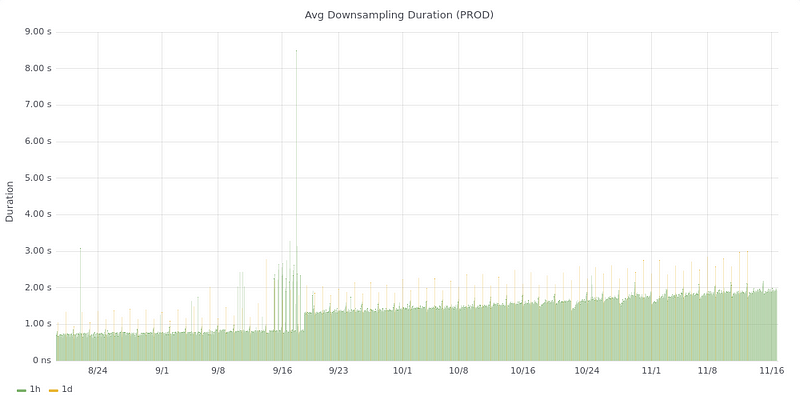
Long-term downsampling latency trend
What’s next
We’ve been running this architecture using Kafka and TimescaleDB in production for a while and have done lots of different things with it in terms of feature use and monitoring. That said, there are still areas where we’re hoping to see improvement, both in how we manage our infrastructure and features that TimescaleDB can implement.
How we can improve our infrastructure
Optimal chunk size: We haven’t determined what the optimal chunk size is, and we haven’t tried out adaptive chunking.
Read replicas: We don’t use read replicas yet. We can easily improve our read query performance by adding a read replica and parallelizing requests.
PostgreSQL 10: We’re still on PostgreSQL 9.6. PostgreSQL 10 introduces JIT compilation and evaluation of WHERE clauses which can really improve queries that have to filter lots of rows.
Better ingest monitoring: We have a lot of visibility into PostgreSQL, but we don’t have visibility into what happens to metrics before PostgreSQL. For example, we’d like to have better metrics on how long it takes for a metric message to be accepted at the API until it makes it into TimescaleDB.
What we’d like to see from TimescaleDB
RDS support: TimescaleDB is the only database we host ourselves. Our other PostgreSQL instances are hosted on RDS. We’d probably use RDS for everything if TimescaleDB was a supported extension.
Compression: We could use ZFS for compression but we haven’t tried that yet. Compression is not a major requirement yet. It would be great if TimescaleDB supported that out-of-the-box.

