MixRadio Architecture - Playing with an Eclectic Mix of Services


This is a guest repost by Steve Robbins, Chief Architect at MixRadio.
At MixRadio, we offer a free music streaming service that learns from listening habits to deliver people a personalised radio station, at the single touch of a button. MixRadio marries simplicity with an incredible level of personalization, for a mobile-first approach that will help everybody, not just the avid music fan, enjoy and discover new music. It's as easy as turning on the radio, but you're in control - just one touch of Play Me provides people with their own personal radio station.The service also offers hundreds of hand-crafted expert and celebrity mixes categorised by genre and mood for each region. You can also create your own artist mix and mixes can be saved for offline listening during times without signal such as underground travel, as well as reducing data use and costs.Our apps are currently available on Windows Phone, Windows 8, Nokia Asha phones and the web. We’ve spent years evolving a back-end that we’re incredibly proud of, despite being British! Here's an overview of our back-end architecture.
Architecture Overview
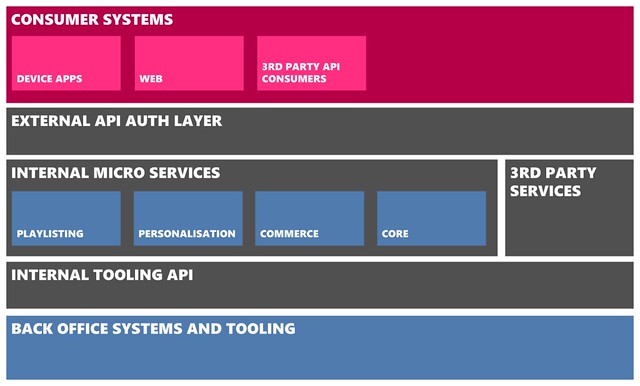
We had the opportunity to re-architect our back-end in 2009. The nucleus of our back-end today is a collection of RESTful services in the pattern termed as ‘Microservices’. These services vary in size, function, development language and data storage, but all share common attributes such as exposing well-defined RESTful APIs, being independently scalable, including monitoring capabilities and more that we’ll cover below. Around these core services, we have two similar proxy services that are config-driven to expose a subset of RESTful resources for different purposes. The ‘Internal Tooling API’ proxies internal APIs for tooling to cover customer care, content management, publishing mixes, monitoring and many other scenarios. Publicly, our RESTful API for client apps and third party developers is exposed through the ‘External API auth layer’ service. This service also has the job of enforcing appropriate permissions and authorisation schemes such as OAuth2.
For end-users, the range of applications served by our API is quite broad. We offer our HTML5 website, device apps for all the different types of Nokia phones, a Windows 8 app and we also offer a subset of the same API to 3rd party developers. I’m not going to go into the detail on our app architecture in this post, as Nathan from our team has written about that previously.
The diagram below gives a high-level overview of the main areas of the system, in which over fifty microservices reside:
Technologies Used
We take a pragmatic approach of using the right tool for the job with a focus on open source technologies. Currently we are actively using:
Languages
- Clojure used for our microservices.
- C# used for our device apps and Media Delivery services.
- HTML5 / CSS / JavaScript used for our web experience.
Storage
Infrastructure
- AWS for Linux microservices.
- Azure for Media services running on Windows and media storage.
- GitHub Enterprise for source control.
- Packer for creating machine images.
- Puppet for provisioning and keeping machine images in check.
Monitoring
Architecture Principles
To keep the APIs consistent with over fifty microservices, we have standards around URI structures, paging, sorting, casing, dealing with language codes and so on; but in an open culture, we generally use principles rather than hard rules to gain consistency. Our services should:
- Be loosely coupled, stateless and provide a RESTful interface of JSON over HTTP.
- Deploy separately and own their data, i.e. other services access data through APIs, not a database connection. This allows separate scale as well as changes in persistence technology and data structure.
- Neither be too big so as to be cumbersome, nor too small to make it a waste of computing resource as we use one machine instance per service.
- Implement healthcheck APIs for monitoring and be responsible for determining health.
- Never break their consumers. We agreed a standard early on to have a version number in resource paths (e.g.
/1.x/products/12345/), such that if there is a need for a breaking change, a new version can be deployed side-by-side and get adopted by upstream consumers. Even though we still keep this capability, we haven’t needed to use it for years.
Along with these internal principles, for our public facing APIs, we add the following:
- APIs are mobile optimised: we use JSON as it requires less memory to parse than XML on low power devices, responses are encoded with GZIP wherever possible and most importantly - if data is not necessary, it’s not returned. This last point is a fine balance with API consistency.
- Caching is applied wherever possible; APIs return appropriate cache headers such that content gets cached on end-user devices and browsers, as well as Content Delivery Networks (CDNs) to get content closer to our consumers in the first place.
- As much logic and data truth as possible is held in the cloud to reduce duplication of logic in apps and give a consistent experience.
- The same API is used for all clients - web, mobile, desktop and the 3rd Party subset. However, to optimise for different screen sizes and requirements, we use a few techniques. An obvious one is the “itemsperpage” querystring parameter to adjust the amount of content returned; another works around RESTful API design where resources return isolated content. We often group content into what we call “views” to reduce the number of requests required.
An example of using a view API is the artist detail page in our apps that consists of data from many resources - artist biography, images, tweets, gigs, which mixes they feature on, top albums, top songs and similar artists. By combining this into a “view”, apps get the data in one hit of around 5KB.
Rapid Microservices
For the last few years, we have built our microservices in Clojure instead of Java. Clojure is a dynamic language that still runs on the Java Virtual Machine (JVM) and also allows access to Java frameworks. Our back-end team choose to use Clojure because of the speed - both at development and runtime. Clojure is far more concise than Java - an example of this is one of our Java services that was redeveloped in Clojure and went from 44,000 to 4,000 lines of code (including all configuration, tests and other artifacts). We use Leiningen to speed up development - one aspect Leiningen offers is custom project templates and we have a template called cljskel that creates a skeleton service for us. We aim to come back to this template in a future post, but to illustrate use, we’re able to run the following command and have a functional RESTful service with monitoring APIs:
lein new cljskel <project name>
If you’re interested in how we got into Clojure, you might want to watch the talk two of our engineers did in London last year.
Data
The two largest sources of data we deal with are content metadata for the 32+ million tracks we have (along with associated artists, albums, mixes, etc.) and analytics data coming in from our apps such as playback events, thumbs up/down and navigation events.
The Catalogue services (see diagram below) provide the content metadata and search capabilities for our consumer experiences. The ‘Master Catalogue’ service stores raw data from various sources such as record labels, our internal content team and Internet sources like Wikipedia. A configuration-driven data model specifies how to merge the sources (e.g. prioritise certain fields that get correction from our content team over other sources), which fields are searchable and which are returned to callers. We can return different fields to cater for different use-cases; for example we don’t need the list of album tracks in search results, but we do need them when showing album details. The Master Catalogue service does not serve consumer traffic directly, instead the ‘Search and Query’ API is the interface for the rest of the back-end. The Search and Query service is built on Apache Solr and the ‘Index Daemon’ service crawls Master Catalogue for updates that are published to the Solr search index.

Collecting analytics and usage data is vital for driving personalised experiences, conducting A/B testing, CRM, calculating business metrics and contractual reporting. As data arrives in the back-end from our various apps in waves throughout the day, many services need access to the same data simultaneously. One example would be a user has pressing the ‘thumbs down’ button against a track, it’s important in the context of the current mix of tracks getting played and to the overall taste profile of a user, where repeated thumbs down implies not liking the artist. To be able to handle the volume of data we expected, we decided early last year that we needed a publish-subscribe model that would:
- Be highly available with no single point of failure.
- Provide scalability for the whole system by decoupling and the ability to pause incoming messages.
- Be agnostic to message format.
- Have low latency for writes (i.e. “fire and forget” semantics).
- Give fast throughput to subscribers.
- Provide simple publish and subscribe APIs.
- Support multiple subscribers for the same data, each having potentially different architectures and operating at different speeds and schedules. Examples being real-time processing vs batch aggregation or archiving.
We chose Apache Kafka from LinkedIn as it was a near-perfect fit for what we needed. In particular it is a persistent messaging system, designed to support many consumers having their own state (e.g. position of reading data) rather than assuming subscribers are permanently present and consume data at the same rate.
Monitoring
We target ourselves with <0.8 second latency for key use cases and 99.99% availability over a rolling 90-day period - that equates to 4.3 minutes of downtime per month. So when things go wrong, how do we know when there are problems and react quickly? We have multiple layers of monitoring in place that alert our dev and ops engineers.
At the lowest level, we use Nagios to check basic health of virtual machines and hook into PagerDuty for alerting ops engineers. We utilise the healthcheck APIs that each microservice implements to let AWS load balancers determine if a box needs recycling (you can read more about how we configure AWS load balancers in this previous post). Graphite is used to gather Operating System level metrics such as CPU usage, disk space, etc. but each microservice also logs custom metrics that are helpful for the engineers involved. The service metrics we collect vary from low level items (e.g. HTTP 500 error counts) to higher-level abstractions (number of subscriptions being activated), whatever is useful. Here’s an example Graphite dashboard:

We use Tasseo on top of Graphite to provide nice dashboard summary views of data and Seyren to alert based on threshold changes. Seyren was started by some of our engineers and received a mention in an article about the tech used in the 2012 Obama re-election campaign.

At the highest level, we monitor use cases and response times around the world with Keynote:

Finally, for detailed diagnostics, we avoid having to connect to specific servers by log shipping. We gather system, request, error and application-specific logs to a central place with Logstash and use Kibana along with custom dashboards to track down specific errors or see trends. This example is a custom dashboard from when we were trying to reduce application error noise a few years ago:

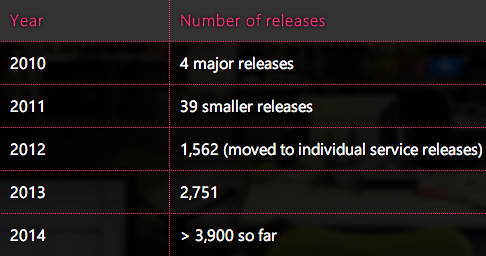
Continuous Delivery
Continuous Delivery is the practice where software can be rapidly released in a repeatable way by automating deployment and testing. We’ve spent years evolving our process starting from big bang releases; moving to a deployment pipeline and then to where we are today with a Netflix “red / black” style model in AWS. Joe from our engineering team talked about this at the London Continuous Delivery Meetup in June.
You can see our progress by looking at the number of deployments we’ve done over the last five years: