The Image Optimization Technology that Serves Millions of Requests Per Day

This article will touch upon how Kraken.io built and scaled an image optimization platform which serves millions of requests per day, with the goal of maintaining high performance at all times while keeping costs as low as possible. We present our infrastructure as it is in its current state at the time of writing, and touch upon some of the interesting things we learned in order to get it here.
Let’s make an image optimizer
You want to start saving money on your CDN bills and generally speed up your websites by pushing less bytes over the wire to your user’s browser. Chances are that over 60% of your traffic are images alone.
Using ImageMagick (you did read ImageTragick, right?) you can slash down the quality of a JPEG file with a simple command:
$ convert -quality 70 original.jpg optimized.jpg
$ ls -la
-rw-r--r-- 1 matylla staff 5897 May 16 14:24 original.jpg
-rw-r--r-- 1 matylla staff 2995 May 16 14:25 optimized.jpg
Congratulations. You’ve just brought down the size of that JPEG by ~50% by butchering it’s quality. The image now looks like Minecraft. It can’t look like that - it sells your products and services. Ideally, images on the Web should have outstanding quality and carry no unnecessary bloat in the form of excessively high quality or EXIF metadata.
You now open your favourite image-editing software and start playing with Q levels while saving a JPEG for the Web. It turns out that this particular image you test looks great at Q76. You start saving all your JPEGs with quality set to 76. But hold on a second… Some images look terrible even with Q80 while some would look just fine even at Q60.
Ok. You decide to automate it somehow - who wants to manually test the quality of millions of images you have the “privilege” of maintaining. So you create a script that generates dozens of copies of an input image at different Q levels. Now you need a metric that will tell you which Q level is perfect for a particular image. MSE? SSIM? MS-SSIM? PSNR? You’re so desperate that you even start calculating and comparing perceptual hashes of different versions of your input image.
Some metrics perform better than others. Some work well for specific types of images. Some are blazingly fast while the others take a long time to complete. You can get away by reducing the number of loops in which you process each image but then chances are that you miss your perfect Q level and the image will either be heavier than it could be or quality degradation will be too high.
And what about product images against white backgrounds? You really want to reduce ringing/haloing artifacts around the subject. What about custom chroma-subsampling settings on per-image basis? That red dress against white background looks all washed-out now. You’ve learned that stripping EXIF metadata will bring the file size down a bit but you’ve also removed Orientation tag and now your images are all rotated incorrectly.
And that’s only the JPEG format. For your PNGs probably you’d want to re-compress your 7-Zip or Deflate compressed images with something more cutting-edge like Google’s Zopfli. You spin up your script and watch the fan on your CPU start to melt.
You probably need a reliable tool that will optimize all your images, regardless of the format. Kraken.io is one such tool.
About Kraken.io
Kraken.io is an image optimization and compression SaaS platform with additional manipulation capabilities such as image resizing. Our goal is to automatically shrink the byte size of images as much as possible, while keeping the visual information intact, and of consistently high quality such that results never need to be manually checked for fidelity.
Software
Almost all our software is written in Node with the exception of the Kraken.io frontend which is PHP-based. We make heavy use of Node Streams as our optimization pipeline is capable of consuming a stream of binary data.
When an image first comes to our platform it is first pumped through the “kraken-identify” process to reliably detect the most important features - image format (JPEG, PNG, GIF, SVG, etc), image type (progressive/baseline JPEG, animated/static GIF, etc), and the presence of embedded colour profiles and EXIF metadata.
We only need a few bytes to be read and don’t need to decompress the whole image nor do we need to load the decompressed data into the memory.
After we’re sure that the file we’ve just received is indeed an image we will process it further. For some specific images we additionally calculate the number of unique colours. Unique colours count is a histogram type operation which is inherently slow and can’t be done on compressed data so we only use it on a very specific subset of images.
The image is then passed through our optimization pipeline over HTTP. That allows us to pump the binary data (the image itself) along with optimization settings (as fields or headers). The HTTP connection with our optimization clusters is held open until the process finishes and the HTTP response from the cluster is streamed back to disk - directly to a GlusterFS target location so we don’t touch the disk too often. As we stream back the whole response from clusters any post-optimization data is transmitted via HTTP headers.
Optionally, if the API user requests, we can store optimized assets in his or her external storage of choice - S3, Azure, Cloud Files or SoftLayer.
The last task (for the API) is to terminate the HTTP connection with the API client responding with optimization results, for example:
{
"file_name": "sku126933.jpg",
"original_size": 35761,
"kraked_size": 10799,
"saved_bytes": 22462,
"kraked_url": "https://dl.kraken.io/api/3e/db/24/08e20232a13c35fc1a72356537/sku126933.jpg",
"original_width": 600,
"original_height": 600,
"success": true
}
Users who are not interested in immediately parsing the response body can make use of our Webhook delivery system. By specifying a callback_url in the request, users are instructing the API application to POST optimization results to their own endpoints. In that case we enqueue a Webhook task (using Redis as a broker). Additional machines, designated only for Webhook delivery, consume from the queue, POST optimization results and save some data in MongoDB.
Delivered Webhooks view in the Kraken.io Account
Hardware
Image optimization and recompression has enormous processing requirements. Cloud was never an option for us as we are continuously trying to lower our total cost of ownership. By signing a pretty long contract with our datacenter we were able to reduce colocation bills by 30%.
For a brief moment, before investing into our own hardware, we had been renting dedicated machines. That didn’t work as expected. OS re-deployments were blocked by our provider (at that time) and we had to take the painful and time-consuming path of email communication just to redeploy the system. Also, you don’t know who has been using the machine before you, what’s the overall health of the machine and what components are *really* installed inside. One day we’ve discovered that even though all API machines had the same CPU installed, every machine had a different CPU firmware and sysbench results were drastically different from machine to machine.
Luckily those times have long passed and we’re operating on our own hardware where we can fine-tune all the settings as we like (try playing with CPU frequency scaling on rented dedics).
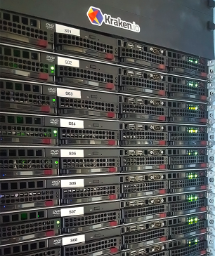
All single-socket machines (API, Web, Load Balancers, Webhook Delivery) are currently running Xeon E3-1280 v5 (Skylake). For Optimization Cluster where all the hard work is done we use 2 x Xeon E5-2697 v3 per machine with 128 GB RAM and four SSD hard drives in RAID-1 setup for mirroring. With HT enabled the above setup gives us access to 28 physical cores and 56 threads per Cluster machine.
One of our optimization workers (Xeon E5-2697)
Intel recently introduced v4 (Haswell) for E5-2600 line and we’re looking into this but have no urgency in upgrading the Cluster to v4.
Kraken.io’s platform is both CPU and I/O intensive, performing heavy processing on a large number of files. To gain more performance on the I/O level we will be rolling out PCIe-SSD drives for our API, Cluster and Storage machines in the coming months.
API, Storage and Optimization Cluster
Own hardware comes at a certain price. And that price is that you need to have *a lot* more capacity than you actually need even for peak days. It takes us up to 7 days to order, stress-test and deploy new machines. We have come up with a custom AWS integration that would provision compute optimized instances for us and extend our Optimization Cluster. Luckily we’ve never had use it even though we’ve seen load as high as 60 on Cluster machines (1.07 per thread). The downside to that solution is that we would have to pay extra not only for AWS instances but also for extra traffic between our datacenter and AWS.
Provisioning, discovery and software deployments
Every new machine we install is managed and configured by Foreman. We keep all the configuration in Puppet so bringing a new machine to production-ready state only takes a couple of clicks. Maintaining a healthy codebase in Puppet is another topic for discussion, especially when talking about custom-built packages.
Software deployment is done through Capistrano. We use similar recipes for almost all our applications as all applications are written in Node. Integration with Slack is very helpful when we need to pinpoint a specific deployment that happened in the past and correlate that with the data available in ServerDensity or ElasticSearch.
Slack integration for Capistrano
Data Store
We use MongoDB in a Replica setup on three independent machines as our primary data store. As our dataset is relatively small and we use capped collections for all time series data DB sharding was something we never really have considered. Of course, watching two out of three DB machines doing almost nothing but waiting for a Master to fail is not something I enjoy but when the time comes (and it will) we will sleep just fine.
The second data store is Redis in a Sentinel setup (for the same reasons as the above). Used primarily as a message broker for the task queue and session management on Kraken.io frontend.
File Storage
In a previous generation of Kraken.io we used to store optimized assets directly on the same machines that did the optimisation work. As we’ve decoupled the roles (API, Web, Processing Cluster and Storage) we’ve found ourselves in the immediate need of a scalable network file system. GlusterFS was easy to setup and it is easy to maintain.
We have millions of images flying over the wire from application servers to GlusterFS machines. It is very important for us not to move those files too often. Once saved in Gluster an image stays there until its automatic removal.
Speaking of which - the cleanup jobs. Images optimized through the API are automatically removed after 1 hour while those processed through the Web Interface live in our system for 12 hours. Cleanup scripts running on storage machines need to first stat all the directories and pick those with mtime > 1hr (or mtime > 12hr for Web Interface). When you have millions of directories a simple stat on them can take a substantial amount of time and we want our cleanup scripts to run fast. The simple remedy that works is to put the directories with optimized images into another three levels of two-char directories.
Original file ID which serves as a destination directory, for example dd7322caa1a2aeb24109a3c61ba970d4 becomes dd/73/22/caa1a2aeb24109a3c61ba970d4
That way we have up to 255 directories to traverse on the first, second and third level.
Load Balancers
Both external and internal load balancers are Nginx-based with Keepalived on each one of them. Even if both of our externals go down the internal ones will automatically promote themselves and also serve the public traffic. That also helps us to sleep at night and gives us time to travel from Berlin to Frankfurt with new machines (1hr flight).
We don’t use any HTTP servers on our internal machines. All the internal traffic is reverse-proxied from load balancers directly to Node applications. One thing to remember - Nginx by default uses HTTP protocol 1.0 for HTTP proxy. Turning proxy_http_version flag to 1.1 saves a lot of trouble and generally improves performance especially on long-running keep-alive connections.
Networking
As we’re also redundant on the uplink level (two independent 10 Gbps uplinks) we needed at least two switches per rack and two Ethernet controllers per machine. As the racks grow and each machine occupies five ports on the switch (BMC, Uplink A and B to Controller 1 and Uplink A and B to Controller 2) currently we’re running four HP ProCurve switches per rack.
Kraken.io Architecture, May 2016
Monitoring and Alerting
In the previous generation of Kraken.io we used Sensu, Graphite and InfluxDB. As we wanted to shift our full attention to the product itself and not maintain and monitor the monitoring tools (who’s monitoring the monitoring tools which are monitoring them?) we needed a SaaS that would take that pain away. After testing several services we finally settled with ServerDensity as our primary monitoring and alerting tool for all our machines and it works flawlessly so far.
ServerDensity metrics are always displayed in our office
As an additional measure we use Pingdom for uptime and Real User Monitoring. We’ve seen a couple of false positives from Pingdom and the cure for that was simply to increase the number of checks that needed to fail in order for the alert to come up.
Data Mining
As we try to keep the number of supported technologies to a bare minimum we use an external ElasticSearch provider. On an average day we ship 2GB of logs for further processing and data mining. It is very convenient to be able to query ES like this:
“Give me optimization results for JPEG files below 800 KiB with embedded ICC profile, unique colour count above 10.000, optimized losslessly 3 days ago by user X”.
As we’re constantly working on improving the optimization stack we need to be able to immediately track the results of our deployments. At peak loads it is enough to do a small tweak in the Optimization Cluster and get meaningful data in a couple of minutes.
Summary
If you made it this far, that about covers the interesting parts of Kraken.io’s infrastructural engineering. We are sure that we will continue to learn more as we move forward and grow our subscriber base, and we hope you enjoyed the read.


