An Epic TripAdvisor Update: Why Not Run on the Cloud? The Grand Experiment.

This is a guest post by Shawn Hsiao, Luke Massa, and Victor Luu. Shawn runs TripAdvisor’s Technical Operations team, Luke and Victor interned on his team this past summer. This post is introduced by Andy Gelfond, TripAdvisor’s head of engineering.
It's been a little over a year since our last post about the TripAdvisor architecture. It has been an exciting year. Our business and team continues to grow, we are now an independent public company, and we have continued to keep/scale our development process and culture as we have grown - we still run dozens of independent teams, and each team continues to work across the entire stack. All that has changed are the numbers:
- 56M visitors per month
- 350M+ pages requests a day
- 120TB+ of warehouse data running on a large Hadoop cluster, and quickly growing
We also had a very successful college intern program that brought on over 60 interns this past summer, all who were quickly on boarded and doing the same kind of work as our full time engineers.
One recurring idea around here is why not run on the cloud? Two of our summer interns, Luke Massa and Victor Luu, took a serious look at this question by deploying a complete version of our site on Amazon Web Services. Here, in their own words, and a lot of technical detail, is their story of what they did this past summer.
Running TripAdvisor on AWS
This summer, at TripAdvisor we worked on an experimental project to evaluate running an entire production site in Amazon’s Elastic Cloud Computing (EC2) environment. When we first started to experiment hosting www.tripadvisor.com and all international domains in the EC2 environment, the response from many of the members of our engineering organization was very simple: is it really worth paying Amazon when we already own our own hardware? And can it perform as well?
A few months later, as our great experiment in the cloud comes to a close, the answer is, of course, yes and no. We have learned a lot during this time, not only about the amazing benefits and severe pitfalls to AWS, but also how we might improve our architecture in our own, traditional colocation environment. And though we are not (yet?) prepared to flip over the DNS and send all traffic through AWS, its elasticity has proven to be an extremely useful and practical, learning tool!
Project Goals
- Build an entire site using EC2 and demonstrate that we can take production level traffic
- Build a cost model for such an operation
- Identify architectural changes that can help reduce cost and increase scalability
- Use this move to a new platform to find possible improvements in our current architecture
Architecture
Our goal was to build a fully functioning mirror of our live sites, capable of taking production level traffic. We called it “Project 700k”, because we were attempting to process 700k HTTP requests per minute with the same user experience as our live site. The user experience is to be measured by the request response time statistics. With a lot of fiddling and tweaking, we eventually came up with the following system architecture:
Virtual Private Cloud - All of our servers are hosted in a single VPC, or Virtual Private Cloud. This is Amazon’s way of providing a virtual network in a single geographical region (we happen to US East, Virginia, but theoretically we could spin up a whole new VPC in California, Ireland, etc.), all instances addressing each other with Private IPs.
Subnets - Within the VPC we have two subnets, each currently in the same availability zone for simplicity, but we plan to later spread them out for redundancy. The first subnet has its security settings to allow incoming and outgoing traffic from the internet, which we call the Public Subnet. The second one, the Private Subnet, only allows traffic from the public subnet. The Public Subnet houses a staging server which allows us to ssh into the private subnet, and a set of Load Balancers we’ll address later. All of our servers, memcache, and databases are located in the Private Subnet.
Front and Back end Servers - Front ends are responsible for accepting user requests, processing the requests, and then displaying the requested data to the user, presented with the correct HTML, CSS and javascript. The front ends use Java to handle most of this processing, and may query the memcache or the back ends for additional data. All front ends are created equal and should be carrying similar traffic assuming that the servers are load balanced correctly.
Back end instances are configured to host specific services, like media or vacation rentals. Because of this distribution, some servers are configured to do several smaller jobs, while others are configured to one large job. These servers may also make memcache or database calls to perform their jobs.
Load Balancers - To take full advantage of the elasticity, we use Amazon’s ELBs (Elastic Load Balancers) to manage the front end and back end servers. A front end belongs exclusively to a single pool, and so is listed under only one load balancer. However, a back end could perform several services and so is listed under several load balancers. For example, a back end may be responsible for the search, forums, and community services, and would then be part of those three load balancers. This works because each service communicates on a unique port. All of the front and back end servers are configured to send and receive requests from load balancers, rather than with other instances directly.
Staging Server - An additional staging instance, which we called stage01x, handles requests going into the VPC. It backs up the code base, collects timing and error logs, and allows for ssh into instances. Because stage01x needs to be in the public subnet, it receives an elastic IP from Amazon, which also serviced our public-facing load balancer to our AWS site hosted behind it at the early stages. stage01x also maintains a postgresql database of the servers’ hostnames and services. This serves a vital function in adding new instances and managing them throughout their lifetime, which we’ll discuss later.
Diagram of VPC Site Architecture
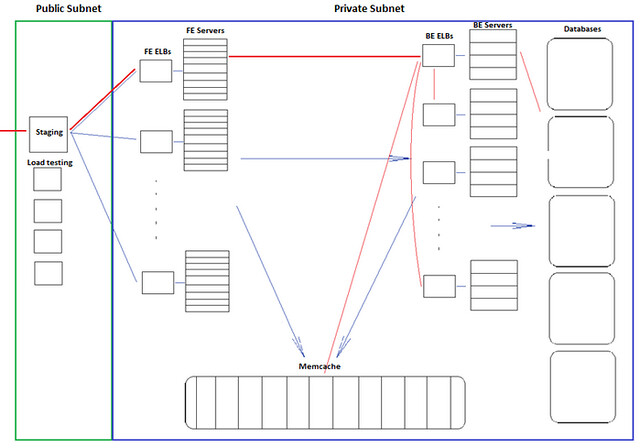
Sample HTTP request - To understand the architecture more fully, let’s walk through an HTTP request from the internet, outlined as the red line. It enters the VPC at the staging instance acting as a Load Balancer in the Public Subnet running NGinx via its Elastic IP. The load balancer then routes traffic to one of the front end load balancers. The ELBs then redirect to the front end servers behind them, that begin to process the request. We have two levels of load balancing here to separate requests into different pools for AB testing.
The front end server then decides it needs to make a request to a back end service, which is being run by a number of back end servers, also behind an ELB. A back end processes the request, perhaps making a request to other back ends, or a database server (the result of which is stored on a memcache server), and sends information back to the front end, which sends it back through the load balancer to the user.
Instance Types - EC2 is extremely scalable, so with some scripts, we were able to quickly change the number of back and front end servers in the network. Because all the back ends and front ends are behind load balancers, no one ever needs to address them directly or know what they are.
However, databases were harder to scale because they were not behind a load balancer. As would be predicted, memcache hashes key-value bindings based on the number of instances and RAM on each instance, both of which are assumed to be fixed. There are versions of memcache that allow for addition/deletion of membership, but we don’t not currently use that in our application stack. Therefore, live scaling of memcache would not be simple or efficient.
We chose m2.xlarge (high memory extra large) instances for our front end, back end, and memcache instances because they had the right amount of memory and high CPU. cc2.8xlarge (cluster compute eight extra large) instances were used for our databases, which need extremely high iops to be able to handle a cold start with empty caches of the entire site.
How It Works
TACL - Our front end and back end servers are configured via TACL, TripAdvisor Configuration Language, a configuration language that describes how the instances are set up. Essentially, we created an “aws.ini” file that defines where to send and receive certain requests.
For example, forums data (DEV_DB_FORUMS_HOST) is stored on dbs001x and community data (DEV_DB_COMMUNITY_HOST) is stored on dbs003x. Memcache instances are referenced directly by their hostnames.
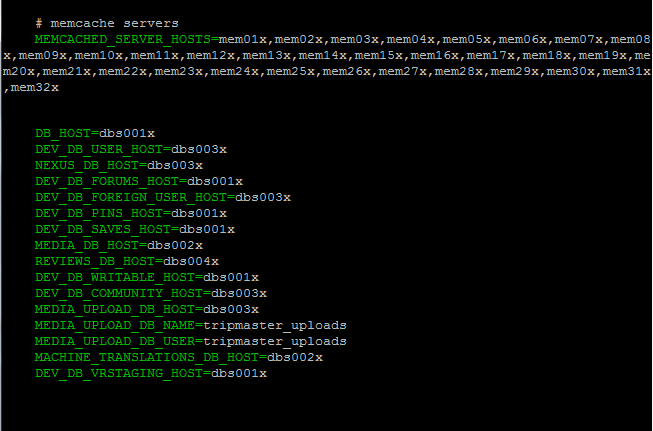
As explained earlier, each front end pool and back end service group is represented by a load balancer, which we prefix with lbf or lb, respectively.
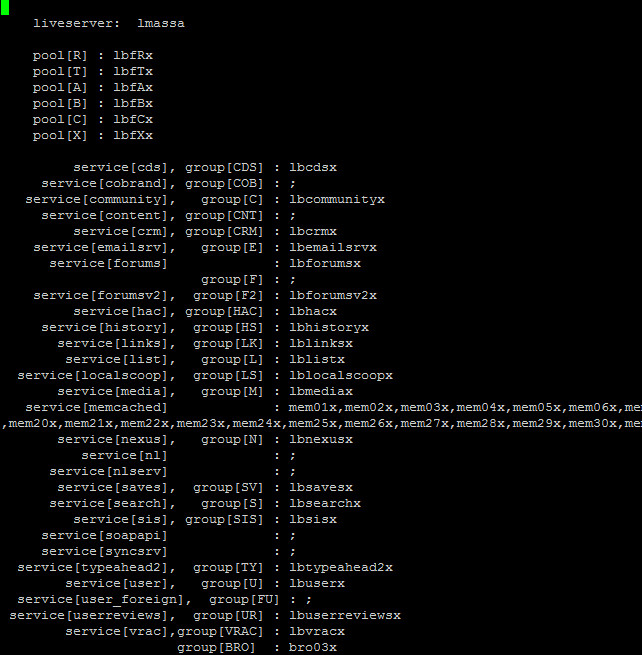
Each server that needs the information in the aws.ini adds its hostname in the file header. As an example, this would be the header of web110x’s aws.ini file.
TACL is set up so that a server refers to this aws.ini file when it is configuring, bouncing, and serving. To push out architectural changes (like adding a new database), we would modify and distribute this aws.ini file, and bounce the relevant instances. With this load balancer abstraction, it is fairly easy to add new front end and back end instances, as they would be contained by appropriate ELBs.
Naming_service DB - Our current live-site uses physical servers housed in our colocation datacenters. Because of this, it is rather expensive and time-consuming to scale up or upgrade our instances. The primary advantage of using Amazon EC2 is that we can do this cheaply and quickly in response to minute-by-minute shifts in traffic. In order to manage this, we keep a database on stage01x that stores a naming database.
This database is critical for our operational needs because of the relatively ephemeral nature of EC2 instances. We occasionally terminate instances and possibly launch replacements. Developing an API that works with this database ensures that the system is “refactored” properly, so that old instances are removed from the load balancers, for example. And of course, this database is necessary when scaling up by launching new instances. It stores hostname, instance ID and services for each given front end and back end instance. Scripts on stage01x are used to find and allocate hostnames for newly launched instances.
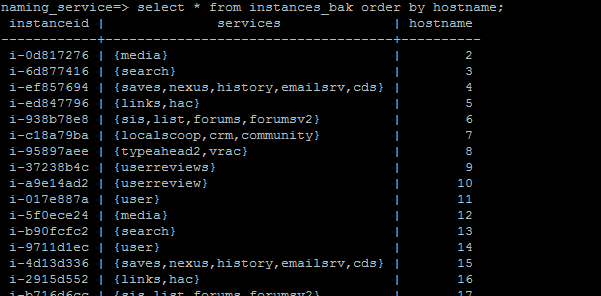
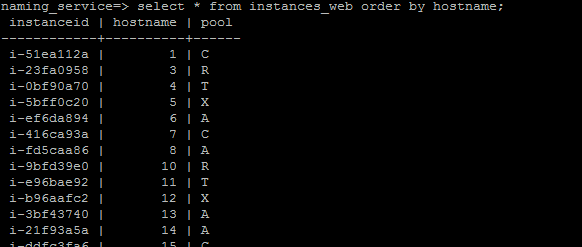
Custom Server Images - We created two custom CentOS 5.7 images for our front end and back end servers. In their /etc/rc.local, we added a script that would be responsible for fully configuring and bouncing the instance. Upon launch, it would query the naming database on stage01x for its hostname and services, add itself to the appropriate load balancer, and then configure and bounce itself. By “bounce” we mean the process of starting or restarting the applications that need to be running on the server.
We are particularly excited about this modularized launching because it makes it easier to test back end services. Rather than bouncing and launching the entire website on one developer’s workstation, a team working on, say, the vacation rentals service, could spin up a vacation rentals instance on EC2, and work specifically with that, without affecting the entire testing environment.
Timing and Error Logs - Our front end servers generate logs as requests are received and processed. Using stage01x and some ssh tunnelling, we can remotely compress these log files and send them back to a local workstation for analysis.
Problems Along the Way
Power outages - On 6/15/2012 EC2 US-East went down, and we lost productivity. On 6/29/2012 EC2 US-East went down, and we lost some instances with it. Amazon does provide availability zones (separated by 20 or 30 miles) to allow for redundancy, so this mitigates the effects slightly. In general, however, Amazon would probably be better known for its data consistency than for its data availability.
Out of Disk Space - As mentioned, our servers generate timing, error, and many other types of logs. In the early stages of testing, our logs, especially error logs, would grow quickly, and take up several GBs of disk space. We decided to take advantage of the m2.xlarge’s 420GB of ephemeral storage. Earlier, we avoided using ephemeral storage altogether, because, well, it’s ephemeral (data doesn’t persist after reboot). However, this was fine for storing logs. Cronjobs shipped the logs onto a local workstation every hour, so we were still able to collect and backup the important data.
Instances Unavailable - We tried using the new SSD hi1.4xlarge instances in us-east-1b, but these were usually unavailable during peak hours. Our Amazon contact told us that these instances really were just unavailable, due to popular demand. We hit a similar problem in us-east-1d, where we failed to launch just an m1.xlarge instance. This served as a reminder that EC2 does not (yet?) have infinite scale of its services, and required reserves need to be built into the operational models for the types of instances and their numbers.
As a side note, each Amazon AWS account starts with a 20 instance cap, and we needed to work with our Amazon contact to raise the limit to 60 instances, and then 600, as our experiment progressed. We ran into similar limits with the our ELBs. Again, our contact was quick to grant us, allowing us the 20-30 load balancers that we needed.
Underutilized, Misconfigured Database - In short, we found that we needed to make additional modifications to our postgresql databases (housed on cc2.8xlarge instances) in order to get them working properly in the EC2 environment. Some of these are listed below. These changes helped us understand how our own environment works compared to Amazon’s.
- enable_hashjoin = off (originally on)
- enable_mergejoin = off (on)
- shared_buffers = 4GB (8GB)
- effective_cache_size = 48GB (16GB)
Lost Data - EC2 provides a nice level of abstraction for data storage through EBS volumes. To extend the storage of our database instances, we simply created 1 TB EBS volumes for each, attached them to the instance, and mounted them using the “mkfs” and “mount” Unix commands.
We ran into a few problems using the EBS volumes. When we were remounting one EBS volume to another instance, the cloud somehow dropped all of our restored members data when transferring one EBS volume to another instance, and we had to spend half a day restoring the database on that instance. Also, we hit problems when trying to resize EBS volumes from snapshots, using commands like “tunefs” and “resize2fs”. The instances that used these resized volumes ran into instance reachability errors a day later, and we had to run “e2fsck” for several hours to clean them up.
Of course, we could have made some critical mistake in mounting and resizing processes, and so are not overly concerned about this behavior from EC2. We’ve found that, generally, the availability of AMIs and EBS snapshots helps us to spin up new database instances quickly. For example, if we wanted to split the data on dbs001x into two machines, we need only create an image of dbs001x, launch a new instance from that, and redirect traffic appropriately. Obviously, this capability is limited only to read-only databases, and creating an image of a 1 TB device is often an overnight job. We are still looking into other ways to improve database redundancy and scalability. Our current live-site uses heartbeat and DRDB for recovery purposes, and we’d be interested in seeing how that can be applied to EC2.
Unequal instances - At one point, we tried to benchmark the CPU performance of our front and back end servers, all of which were m2.xlarge size. We timed a simple math operation, 2^2^20, using the command bc and found that the times fell into two different groups, with statistical significance. We ran cpuid on the tested instances, and faster group was running on dual 2.40 GHz processors, while the slower group was running on dual 2.66 GHz processors. While this was not a major problem in our site’s functionality, it made it harder to determine what computing power was at our disposal.
Also, about 10% of our front end machines would fail to bounce properly, even though they were all the same size and same AMI. Again, this may have been an unforeseen problem with our configuration, rather than Amazon’s.
Negative Times - Normally low times are a cause for celebration. But when we analyzed some recent timing logs, we found that some minimum service call times were negative. These timing statistics were calculated with calls to Java.currentTimeMillis(). We’re still investigating this, and would be interested in trying to replicate the problem with a simple Java app.
Steal Cycles - When we run m2.xlarge instances, we expected to have steal cycles of 1 or 2%. However, we experience jitters of up to 7-8% for a minute or two when the front ends are under load. Our Amazon contact told us that this was just due to the load on each instance.
Also, we ran an experiment on an m1.small instance where we took over its CPU usage with a math calculation. Running top showed that 98% of this was used for the math, and 2% was stolen. However, on Cloudwatch, Amazon’s monitoring service, the instance appeared to be running at 98% CPU utilization, rather than the full 100%. This can cause some problems with larger steal cycles, because it would be impossible to determine if an instance is maxed out due to steal cycles, or if it is “underutilized”. In general, we would’ve liked to see more guarantees on CPU performance.
Multi-cast - Is not supported. We use JGroups and it depends on this to work. We were told to use either vCider, or vpncubed, to simulate multi-cast. vCider would require that we upgrade to CentOS 6, and vpncubed has a long setup time. This was lower on our priority list, but we would like to explore these options more in the future.
ELB Latency - Though our architecture of putting all back ends behind a certain load balancer worked well for traffic under 50-60k reqs/min, we found that the ELB slowed our backend response time considerably, especially with the heavily used services. To test this out, we had one front end send traffic to back end directly, rather than through the ELB. We changed this at around 4:50pm, kept the load test traffic constant, and found this dramatic decrease in service time.

Our Amazon contact told us that ELBs may require pre-warming. We suspect that the load balancers are also cloud platforms, maybe micro/small instances by default. Pre-warming may simply be a matter of upgrading this given platform to one that can handle higher traffic load.
Load Testing
There were a few issues with the original setup of the site. We couldn’t use Amazon’s ELBs on the front end because our front end instances were hidden in the private VPC. We discovered that some companies fixed this by keeping front end instances in the public EC2 network, but this architecture would nullify our VPC setup.
We used a load test system that another engineer had earlier developed, which takes an archived log of real live-site traffic, and sends it at a certain reqs/min. Initially, we directed this traffic at the stage01x instance. However, by the time we reached 20k reqs/min, it became clear that we needed dedicated instances to handle traffic. We named these instances lod01x through lod04x, which would be responsible for sending HTTP traffic to the six front end ELBs.
VPC Bandwidth Issue - In our earlier stages of testing, we had instances outside of the VPC sending traffic into the VPC. However, we found that no matter how we scaled the site, the load test would be capped at 50k reqs/minute. With an average page size of 18KB, it appeared that the VPC was only accepting traffic at 100Mbps. Our Amazon contact reassured us that there was no such limit, but we kept all of the load testing within the VPC to be sure.
NGinx Issues - In our earlier stages, we also installed each lod instance with an NGinx load balancer. However, this later turned out to be a bottleneck for our testing, because the small instances weren’t capable of handling so many “open files”. We scraped this, and sent traffic directly to the load balancers, without the initial NGinx load balancing.
Here is the configuration of our site on our way up to 700k request/min. We were not able to maintain the same user experience on our way to the higher request rates. The request response statistics were deteriorating at higher requests rate, and we will discuss in more details later.

Live-site Comparison - Our live-site has 80 front ends and 52 back ends, each with 24 cores. This adds up to 3168 cores. At our highest AWS configuration, with 270 front ends and 70 back ends at 2 cores each, we only have 680 cores. This led to problems with garbage collection on the back ends, which we’ll discuss later.
Our Amazon memcache is performing fairly well. We benchmarked via the memslap utility that comes with libmemcached-tools, and found that our original 12 Amazon memcache instances performed at about 80-90% of our memcache cluster’s capacity using 12 moderate physical servers.


Timing and error numbers
Each front end server automatically logs timing data for each request that it sends and receives. This compressed and shipped off hourly to the “lumberjack” server, where basic statistics are calculated and requests times are broken down into individual segments, like google, database and xml calls. We are primarily concerned with the average total time and cpu time when gauging site performance.

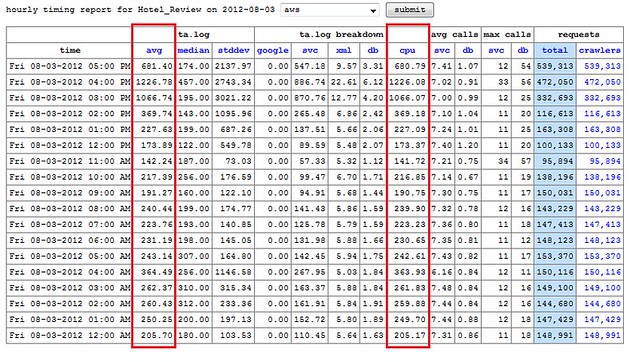
These two charts show the timing statistics for the Hotel Reviews servlet as we scaled up from 20k reqs/min to 60k reqs/min (not all of the requests are going to be related to hotel reviews). From the data, the scale-up occurred between 3-4pm on Friday, and leveled out by 5pm. We turned off the site for the night, then brought it back up around noon on Saturday, with around triple the number of requests.The request timing stayed roughly the same, averaging about 200 ms.
At the lower load, these latency numbers are comparable to our live site, as we scaled up to 150k requests per minute latency increased significantly. Timing for our main servlets, like Hotel Reviews or Typeahead, was almost 10x slower than that of our live-site, which operates at about twice this request level, and has been tested at over four times this request level before showing increased latency.
The ELB is part of the issue, as mentioned before. However, we suspect that the underlying reason is that garbage collection overhead exceeds the amount of CPU that we have for the back end servers. With only two cores, our m2.xlarge instances does not have enough computational power to keep up with GC from high request rate, and this is insufficient for the high application throughput and low application latency. To fix this, we would most likely need to double the number of back ends, or use more powerful instances with more cores. In either case, the focus would be on bolstering the services that receive the higher request rates and perform more work.
Cost
EC2
The payment for EC2 consists of three major parts: instance usage, EBS usage, and network out usage. A network out rate of 200 GB/hr is assumed at production-level, which costs about $14.30 per hour. Predictably, the instance usage for our front and back end servers contributes the most to total cost.
Live-site Comparison
Initial setup of each of our colocated datacenter is about $2.2M, plus about $300K every year for upgrade and expansion. The Capex is about $1M annually if we assume the initial setup cost is amortized over three years. The Opex, including space, power and bandwidth, is about $300K annually. Combined cost for each datacenter is about $1.3M per year. We have over 200 machines in each data center to support our operations. Each machine typically costs $7K.
If we spent the $1.3M per year on a complete EC2 site instead, we could afford the following architecture, provided that we used one-year reserved instances.
- 550 Front and back ends
- 64 Memcache
- 10 Database
Costs $1,486,756.96
This means that we could add more than 60% capacity our current configuration (340 front and backends, 32 memcache, 5 databases).
If we used the three-year reserved instance contract, then such a configuration would cost $0.88M per year. If we wanted to spend $3.9M over three years, we could afford such an architecture:
- 880 Front and back ends
- 64 Memcache
- 20 Database
It is interesting to note that even with this number, we are only getting 1760 server cores (2 on each machine), while our live-site runs on 3500 cores. Nevertheless, we are confident that with such resources would allow us to properly address the garbage collection and latency issues that we are currently encountering at production-level traffic.
General Cost Reduction
- Reserved instances - We calculated that using reserved instances on just a 1-year contract would cut our total annual costs in half. We also don’t need to reserve all instances for peak traffic and leverage either on-demand or lower utilization reserved instances to reduce our overall cost.
- Size instances only to their necessary capacity. Right now, this is done by just launching different proportions of back ends.
- Placement groups - get better performance between instance groups we know will always be there.
Points of Failure
- Having some type of “BigIP-like” instance at the front. What do we do when this goes down?
- Our load balancers are managed by Amazon, what happens when they go down? The references to a full DNS name rather than an IP address is promising, but this is generally unknown.
- Auto-scaling helps with front and back end pools, ensuring that they all stay at a certain number. However, restoring memcache to its hit rate would be time-consuming, and we would need to rely on replicated hot standbys for databases.
Best Practices
- Everything that can be done through the AWS Management Console can be done through the provided command-line tools. Be ready to automate as many parts of the launch process as you can.
- In the automation process, make sure that you wait long enough for the instance to be both running AND reachable:
- “ec2-describe-instances” tells you if the instance is running
- Newer versions of “ec2-describe-instance-status” tell you if the instance has passed the instance and system reachability status checks
- Early on, develop some system for keeping track of all of your instances. This ties back to the GUI issue. Though you can keep track of everything with tags and names, you’ll often need a more automated way to hold everything together. For example, we had a postgresql database on our staging server to manage this.
- Stopped instances might as well be terminated instances. The advantage of cloud computing is that when a certain instance has issues, it’s often easier to launch a new instance in its place, rather than doing a reboot. Obviously, try to find the underlying problem though!
- On this note, be aware that “terminated instances” still hang out in your console and will show up if you run ec2-describe-instances. This is a problem if you are using instance names to differentiate instances, because both instances will show up.
- Clean up your EBS volumes, as the site suggests. The storage costs can add up quickly. Also make sure you clean up snapshots, because those are charged around the same GB-month price as volumes
- Don’t forget about ephemeral storage, but don’t forget that its ephemeral. It’s useful for files that accumulate, like error logs. Use crontabs to save important data.
- Take advantage of images and snapshots to scale up quickly.
- Detailed monitoring is pretty cool, but we found that the free-tier of CloudWatch/monitoring was sufficient. Checking stats at 1 minute vs 5 minutes wasn’t that important for overall scaling decisions. But of course, it could help to enable the detailed monitoring on a representative subset of instances.
- ELBs are also a good way to monitor the instance status, even if they aren’t actually used (we had them lying around after we had changed our architecture). Configure the healthchecks/thresholds appropriately.
- Lots of frustrating networking problems can be solved by paying closer attention to the security group settings.

