Cinchcast Architecture - Producing 1,500 Hours of Audio Every Day

This is a guest post by Dr. Aleksandr Yampolskiy, CTO of Cinchcast and BlogTalkRadio, where he oversees Engineering, QA, TechOps, Telephony, and Product teams.
Cinchcast provides solutions that allow companies to create, share, measure and monetize audio content to reach and engage the people that are most important to their business. Our technology integrates conference bridge with live audio streaming to simplify online events and enhance participant engagement. The Cinchcast technology is also used to power Blogtalkradio, the world’s largest audio social network. Today our platform produces and distributes over 1,500 hours of original content every day. In this article, we describe the engineering decisions we have made in order to scale our platform to support this scale of data.
Stats
- Over 50 million page views a month
- 50,000 hours of audio content created
- 15,000,000 media streams
- 175,000,000 ad impressions
- Peak rate of 40,000 concurrent requests per second
- Many TB/day of data stored in MSSQL, Redis, and ElasticSearch clusters
- Team of 10 engineers (out of 20 Technology).
- Around a 100 hardware nodes in production.
Data Centers
- Production website is run from the data center in Brooklyn. We like to control our own destiny instead of relegating data to the cloud.
- Amazon EC2 instances are used mostly for QA and Staging environments.
Hardware
- About 50 web servers
- 15 MS SQL database servers
- 2 Redis NOSQL key value servers
- 2 NodeJS servers
- 2 servers for elastic search cluster
Dev Tools
- .NET 4 C# : ASP.NET and MVC3
- Visual Studio 2010 Team Suite as an IDE
- StyleCop, Resharper for enforcing code standards
- Agile development methodology, with Scrum used for large features and Kanban taskboard for smaller tasks
- Jenkins + Nunit for testing and continuous integration
- Sauce On Demand – Selenium for automation testing
Software And Technologies Used
- Windows Server 2008 R2 x64: Operating System
- SQL Server 2005 running under Microsoft Windows Server 2008 Web Server
- Equalizer load balancers: for load balancing
- REDIS: used as the distributed caching layer and for message pub-sub queue
- NODEJS for real-time analytics and updating studio dashboard
- ElasticSearch : for show search
- Sawmill + custom parser scripts: for log analysis
Monitoring
- NewRelic for performance monitoring
- Chartbeat for impact of performance on KPI (conversions, page views)
- Gomez, WhatsupGold, Nagios for various alerting
- SQL Monitor: from Red Gate - for SQL Server monitoring
Our Approach
- “Be brief, be bright, be gone” : Respect another person’s time. Don’t come with problems, come with solutions.
- Don’t go chasing hot technologies of the day. Instead ‘mitigate your top problems’. We adopt new technologies but do so, when the business case requires it. Appetite for Production outages decreases significantly when you have millions of users.
- Achieve “essential”, then worry about “excellent”.
- Be a “how team” instead of a “no team”.
- Build security into the software development lifecycle. You need to train developers on how to write secure software and make it a business priority from the start.
Architecture
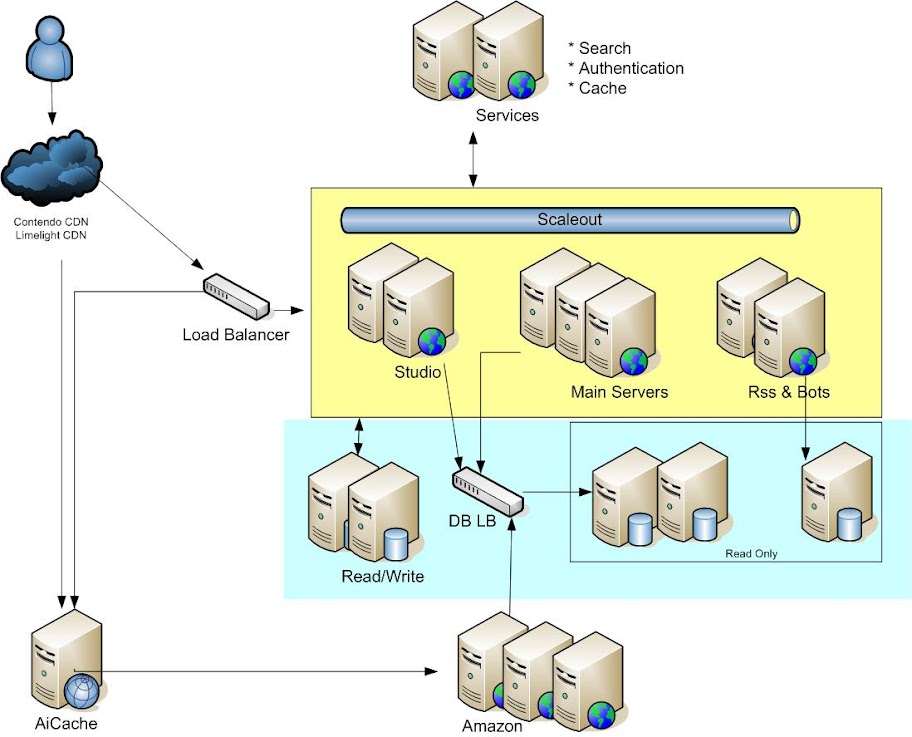
- All Javascript, CSS and images are cached at the CDN level. The DNS points to a CDN which passes requests to origin servers. We use Cotendo because it allows to make L7 routing decisions at the CDN.
- Separate cluster of web servers is used to serve requests for regular users and requests for ad users, differentiated by a cookie.
- We are moving towards a service-oriented architecture where key pieces of the system, such as search, authentication, caching, are RESTFUL services implemented in various languages. These services also provide a caching layer.
- REDIS NOSQL key-value store (redis.io) is used as a cache layer before database calls.
- Scaleout is used to maintain a session state across a garden of web servers. However, we are considering switching onto REDIS.

Lessons Learned
- Text search in SQL server database doesn’t work well. It was clogging up the CPU so we switched to ElasticSearch (a Lucene derivative).
- The built-in session module by Microsoft is prone to deadlocks, so we ended up replacing it with AngiesList session module, storing data to REDIS.
- Logging is key to detecting problems.
- Reinventing the wheel can be a good thing. For example, initially we used a vendor product for bundling JS/CSS together which started causing performance issues. We then rewrote bundling ourselves, and significantly improved performance of our site.
- Not all data is relational, so database isn’t always a good medium. A good analogy is “Imagine you have water flowing down the pipe. The pipe is wide at the top but gets narrow towards the bottom.” The top is the web servers (there are many of them), the bottom is the databases (there are few and they get clogged up).
- Not using metrics in your development process is like trying to land a plane in a storm with your altimeter not working. Throughout your development process, compute metrics such as site throughput, time to fix Blocker/Critical bugs, code coverage and use them to gauge your performance.


